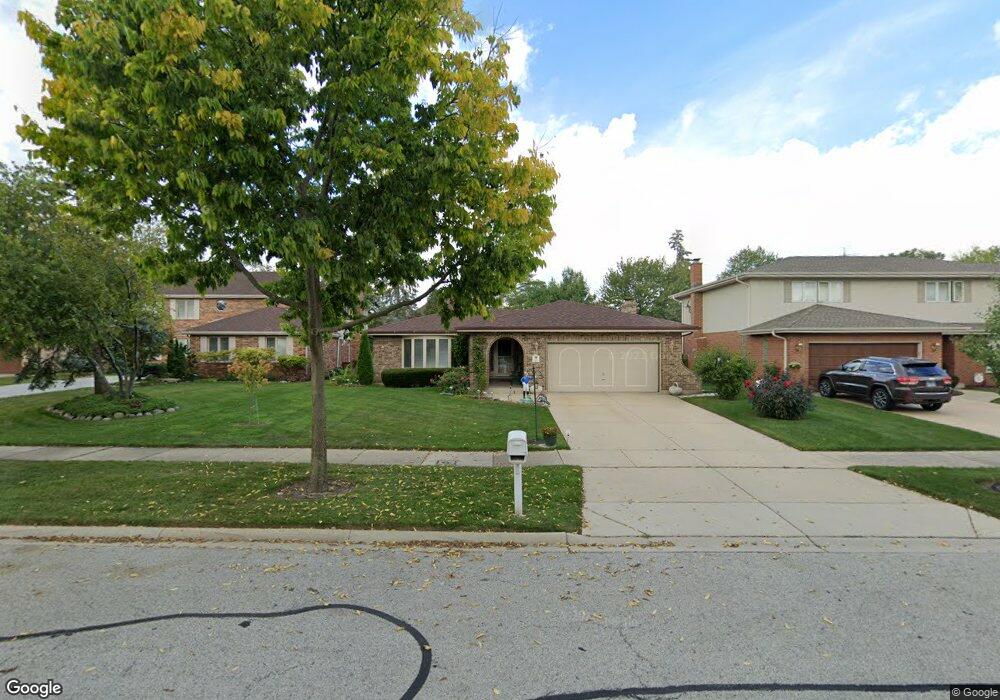
404 Craig Ct Mount Prospect, IL 60056
Colonial Heights NeighborhoodEstimated Value: $530,000 - $654,000
3
Beds
3
Baths
2,012
Sq Ft
$282/Sq Ft
Est. Value
About This Home
This home is located at 404 Craig Ct, Mount Prospect, IL 60056 and is currently estimated at $567,210, approximately $281 per square foot. 404 Craig Ct is a home located in Cook County with nearby schools including Holmes Jr High School, Forest View Elementary School, and Rolling Meadows High School.
Ownership History
Date
Name
Owned For
Owner Type
Purchase Details
Closed on
Jan 20, 2025
Sold by
Patricia L Bauer Revocable Living Trust and Bauer Patricia L
Bought by
Patricia L Bauer Declaration Of Trust and Bauer
Current Estimated Value
Purchase Details
Closed on
Oct 29, 1997
Sold by
Bauer James T and Bauer Patricia L
Bought by
Liv Bauer Patricia L and Patricia L Bauer Revocable Living Trust
Purchase Details
Closed on
May 29, 1997
Sold by
Kim Ha Wook and Kim Hyun Hee
Bought by
Bauer James T and Bauer Patricia L
Home Financials for this Owner
Home Financials are based on the most recent Mortgage that was taken out on this home.
Original Mortgage
$215,000
Interest Rate
8.5%
Purchase Details
Closed on
Feb 27, 1995
Sold by
Klemm Randy M and Klemm Carol
Bought by
Kim Ha Wook and Kim Hyun Hee
Home Financials for this Owner
Home Financials are based on the most recent Mortgage that was taken out on this home.
Original Mortgage
$261,000
Interest Rate
8.75%
Create a Home Valuation Report for This Property
The Home Valuation Report is an in-depth analysis detailing your home's value as well as a comparison with similar homes in the area
Home Values in the Area
Average Home Value in this Area
Purchase History
| Date | Buyer | Sale Price | Title Company |
|---|---|---|---|
| Patricia L Bauer Declaration Of Trust | -- | None Listed On Document | |
| Liv Bauer Patricia L | -- | -- | |
| Bauer James T | $312,500 | Attorneys Natl Title Network | |
| Kim Ha Wook | $290,000 | Land Title Co |
Source: Public Records
Mortgage History
| Date | Status | Borrower | Loan Amount |
|---|---|---|---|
| Previous Owner | Bauer James T | $215,000 | |
| Previous Owner | Kim Ha Wook | $261,000 |
Source: Public Records
Tax History
| Year | Tax Paid | Tax Assessment Tax Assessment Total Assessment is a certain percentage of the fair market value that is determined by local assessors to be the total taxable value of land and additions on the property. | Land | Improvement |
|---|---|---|---|---|
| 2025 | $5,827 | $54,000 | $11,544 | $42,456 |
| 2024 | $5,827 | $43,000 | $9,620 | $33,380 |
| 2023 | $5,770 | $43,000 | $9,620 | $33,380 |
| 2022 | $5,770 | $43,000 | $9,620 | $33,380 |
| 2021 | $6,414 | $33,288 | $6,253 | $27,035 |
| 2020 | $7,628 | $33,288 | $6,253 | $27,035 |
| 2019 | $9,926 | $45,865 | $6,253 | $39,612 |
| 2018 | $6,404 | $29,576 | $5,291 | $24,285 |
| 2017 | $6,649 | $29,576 | $5,291 | $24,285 |
| 2016 | $6,735 | $29,576 | $5,291 | $24,285 |
| 2015 | $7,199 | $29,558 | $4,810 | $24,748 |
| 2014 | $7,131 | $29,558 | $4,810 | $24,748 |
| 2013 | $8,210 | $34,180 | $4,810 | $29,370 |
Source: Public Records
Map
Nearby Homes
- 413 S Carol Ln
- 502 E Haven St
- 1229 S Haddow Ave
- 1707 W Lincoln St
- 1415 E Central Rd Unit 306A
- 1415 E Central Rd Unit 219C
- 11 W Emerson St
- 1338 S Dunton Ave
- 1008 Arbor Ct
- 1703 Bonita Ave
- 1615 E Central Rd Unit 417C
- 901 S Burton Place
- 8 Rob Rd
- 215 E Orchard St
- 1706 S Chesterfield Dr
- 1228 S Chestnut Ave
- 1820 W Thornwood Ln
- 1101 S Lavergne Dr
- 602 W Haven Dr
- 1330 S Ridge Ave
Your Personal Tour Guide
Ask me questions while you tour the home.