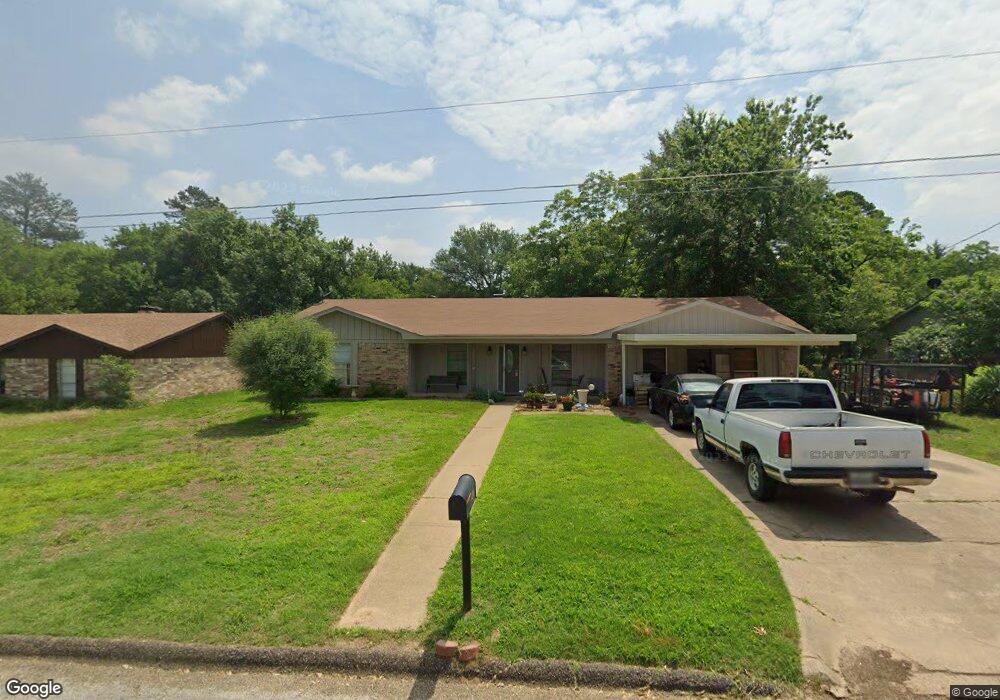
404 Delano St Unit 404 Delano Longview, TX 75604
Estimated Value: $276,000 - $295,000
4
Beds
2
Baths
2,601
Sq Ft
$110/Sq Ft
Est. Value
About This Home
This home is located at 404 Delano St Unit 404 Delano, Longview, TX 75604 and is currently estimated at $285,425, approximately $109 per square foot. 404 Delano St Unit 404 Delano is a home located in Gregg County with nearby schools including Spring Hill Primary School, Spring Hill Intermediate School, and Spring Hill Junior High School.
Ownership History
Date
Name
Owned For
Owner Type
Purchase Details
Closed on
Nov 21, 2023
Sold by
Snow Melanie A and Snow James
Bought by
Vanegas Fabian
Current Estimated Value
Purchase Details
Closed on
Feb 21, 2006
Sold by
Marrable James W and Marrable Shirley Ann
Bought by
Snow Melanie A
Home Financials for this Owner
Home Financials are based on the most recent Mortgage that was taken out on this home.
Original Mortgage
$119,059
Interest Rate
6.1%
Mortgage Type
FHA
Create a Home Valuation Report for This Property
The Home Valuation Report is an in-depth analysis detailing your home's value as well as a comparison with similar homes in the area
Home Values in the Area
Average Home Value in this Area
Purchase History
| Date | Buyer | Sale Price | Title Company |
|---|---|---|---|
| Vanegas Fabian | -- | None Listed On Document | |
| Snow Melanie A | $120,000 | Ctc |
Source: Public Records
Mortgage History
| Date | Status | Borrower | Loan Amount |
|---|---|---|---|
| Previous Owner | Snow Melanie A | $119,059 |
Source: Public Records
Tax History Compared to Growth
Tax History
| Year | Tax Paid | Tax Assessment Tax Assessment Total Assessment is a certain percentage of the fair market value that is determined by local assessors to be the total taxable value of land and additions on the property. | Land | Improvement |
|---|---|---|---|---|
| 2025 | $5,518 | $273,000 | $9,180 | $263,820 |
| 2024 | $5,518 | $260,930 | $9,180 | $251,750 |
| 2023 | $4,199 | $246,490 | $9,180 | $237,310 |
| 2022 | $4,236 | $180,240 | $7,340 | $172,900 |
| 2021 | $4,000 | $168,450 | $7,340 | $161,110 |
| 2020 | $4,010 | $167,810 | $7,560 | $160,250 |
| 2019 | $4,030 | $165,010 | $7,560 | $157,450 |
| 2018 | $3,045 | $165,020 | $7,700 | $157,320 |
| 2017 | $4,064 | $166,380 | $7,700 | $158,680 |
| 2016 | $4,026 | $164,820 | $7,700 | $157,120 |
| 2015 | $3,142 | $166,390 | $7,700 | $158,690 |
| 2014 | -- | $165,850 | $7,700 | $158,150 |
Source: Public Records
Map
Nearby Homes