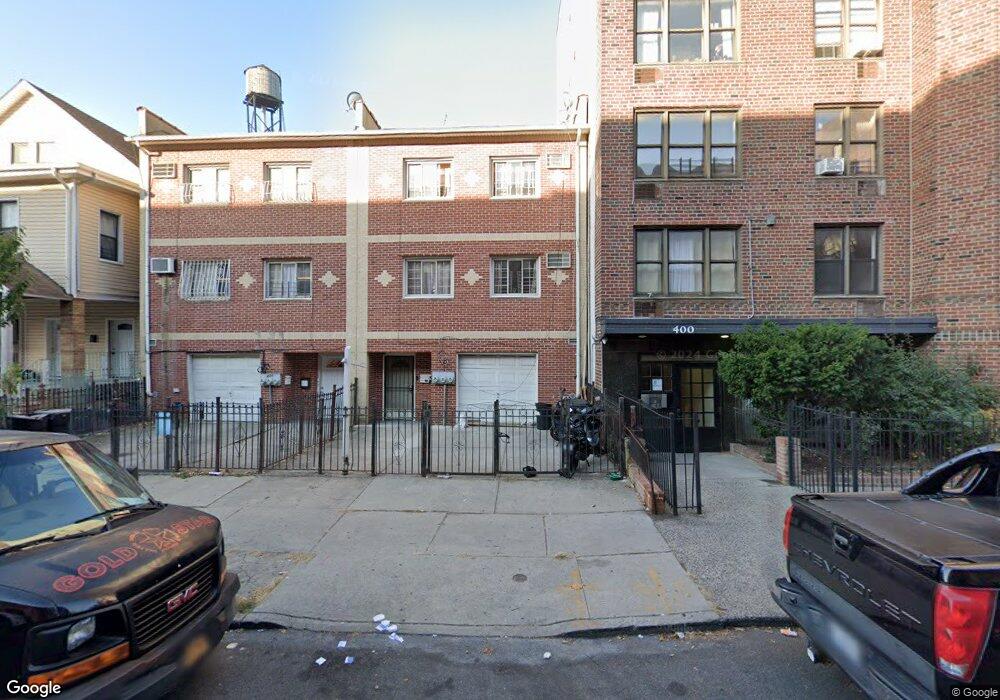
404 E 21st St Brooklyn, NY 11226
Flatbush NeighborhoodEstimated Value: $911,631 - $1,856,000
8
Beds
5
Baths
3,432
Sq Ft
$381/Sq Ft
Est. Value
About This Home
This home is located at 404 E 21st St, Brooklyn, NY 11226 and is currently estimated at $1,306,908, approximately $380 per square foot. 404 E 21st St is a home located in Kings County with nearby schools including P.S. 139 Alexine a Fenty, Middle School 246 Walt Whitman, and Success Academy Charter School-Flatbush.
Ownership History
Date
Name
Owned For
Owner Type
Purchase Details
Closed on
Nov 17, 2003
Sold by
Hosang Jacqueline A
Bought by
Pedro Olalekan
Current Estimated Value
Home Financials for this Owner
Home Financials are based on the most recent Mortgage that was taken out on this home.
Original Mortgage
$392,350
Interest Rate
5.82%
Mortgage Type
Purchase Money Mortgage
Purchase Details
Closed on
Sep 13, 2002
Sold by
Callaham Janie
Bought by
Delisle Lillian
Home Financials for this Owner
Home Financials are based on the most recent Mortgage that was taken out on this home.
Original Mortgage
$56,850
Interest Rate
6.09%
Purchase Details
Closed on
Oct 24, 2001
Sold by
Home Expert Inc
Bought by
Hosang Jacqueline A and Hosang Orlando A
Home Financials for this Owner
Home Financials are based on the most recent Mortgage that was taken out on this home.
Original Mortgage
$239,200
Interest Rate
6.7%
Mortgage Type
Purchase Money Mortgage
Create a Home Valuation Report for This Property
The Home Valuation Report is an in-depth analysis detailing your home's value as well as a comparison with similar homes in the area
Home Values in the Area
Average Home Value in this Area
Purchase History
| Date | Buyer | Sale Price | Title Company |
|---|---|---|---|
| Pedro Olalekan | $406,500 | -- | |
| Delisle Lillian | -- | -- | |
| Hosang Jacqueline A | $299,000 | -- |
Source: Public Records
Mortgage History
| Date | Status | Borrower | Loan Amount |
|---|---|---|---|
| Open | Pedro Olalekan | $251,618 | |
| Closed | Pedro Olalekan | $56,394 | |
| Previous Owner | Pedro Olalekan | $392,350 | |
| Previous Owner | 735 Ocean Ave Llc | $469,005 | |
| Previous Owner | Perkins Michelle | $56,850 | |
| Previous Owner | Delisle Lillian | $303,200 | |
| Previous Owner | Hosang Jacqueline A | $239,200 | |
| Previous Owner | Perkins Michelle | $18,000 |
Source: Public Records
Tax History Compared to Growth
Tax History
| Year | Tax Paid | Tax Assessment Tax Assessment Total Assessment is a certain percentage of the fair market value that is determined by local assessors to be the total taxable value of land and additions on the property. | Land | Improvement |
|---|---|---|---|---|
| 2025 | $9,163 | $58,800 | $24,240 | $34,560 |
| 2024 | $9,163 | $69,180 | $24,240 | $44,940 |
| 2023 | $9,265 | $84,900 | $24,240 | $60,660 |
| 2022 | $9,038 | $81,540 | $24,240 | $57,300 |
| 2021 | $8,989 | $69,360 | $24,240 | $45,120 |
| 2020 | $4,216 | $78,540 | $24,240 | $54,300 |
| 2019 | $7,953 | $62,460 | $24,240 | $38,220 |
| 2018 | $7,750 | $38,016 | $18,219 | $19,797 |
| 2017 | $7,691 | $37,729 | $14,600 | $23,129 |
| 2016 | $7,116 | $35,594 | $16,799 | $18,795 |
| 2015 | $4,888 | $33,580 | $17,849 | $15,731 |
| 2014 | $4,888 | $31,680 | $20,220 | $11,460 |
Source: Public Records
Map
Nearby Homes
- 2107 Beverley Rd
- 2146 Cortelyou Rd Unit 1R
- 1136 Flatbush Ave
- 335 E 18th St
- 320 E 18th St Unit GDN
- 221 E 18th St Unit 5F
- 221 E 18th St Unit 1E
- 221 E 18th St Unit 2D
- 385 E 18th St Unit 2K
- 385 E 18th St Unit 4J
- 2311 Cortelyou Rd
- 608 Ocean Ave Unit 604
- 608 Ocean Ave Unit 803
- 608 Ocean Ave Unit 602
- 608 Ocean Ave Unit 702
- 608 Ocean Ave Unit 504
- 608 Ocean Ave Unit 302
- 608 Ocean Ave Unit 603
- 608 Ocean Ave Unit 304
- 608 Ocean Ave Unit 201
- 404 E 21st St Unit 5
- 404 E 21st St Unit 404 east
- 404 E 21st St Unit Building
- 406 E 21st St
- 412 E 21st St
- 400 E 21st St Unit 3-B
- 390 E 21 St Unit 2 D
- 390 E 21st St Unit 2D
- 390 E 21 St St Unit 3 C
- 390 E 21 St St Unit 3 B
- 390 E 21 St St Unit 2 D
- 390 E 21 St St Unit 3 D
- 390 E 21 St St Unit 2 C
- 390 E 21 St St Unit 1 A
- 390 E 21 St St Unit 4 A
- 401 E 21st St
- 401 E 21st St Unit A2
- 401 E 21st St Unit 20
- 2022 Beverley Rd Unit 3
- 2022 Beverley Rd Unit 13