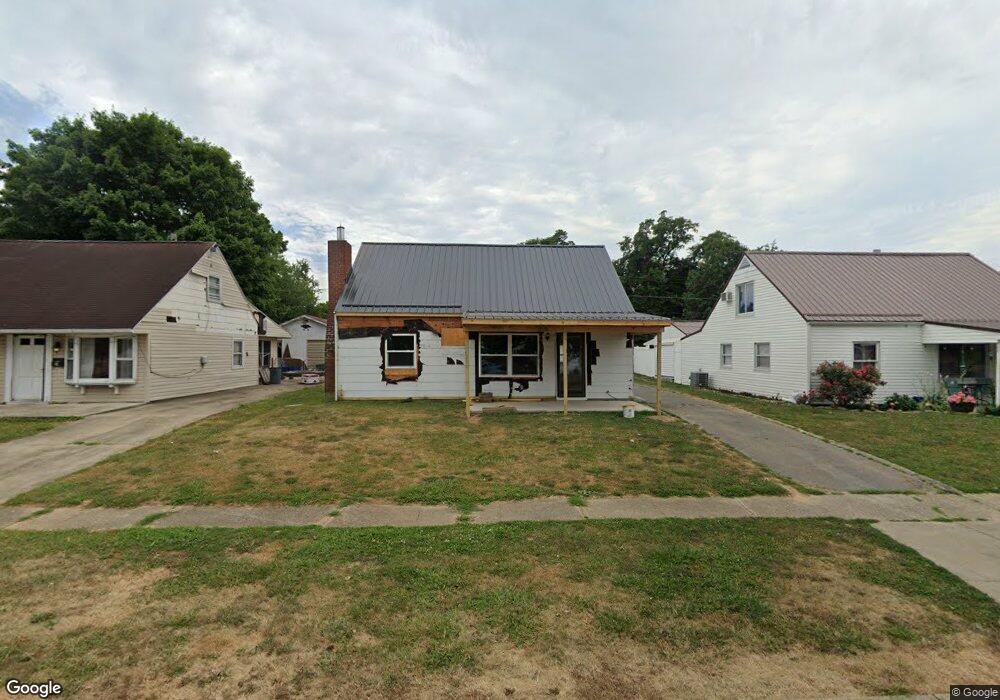
404 E 7th St Waverly, OH 45690
Estimated Value: $117,000 - $183,000
2
Beds
2
Baths
1,488
Sq Ft
$105/Sq Ft
Est. Value
About This Home
This home is located at 404 E 7th St, Waverly, OH 45690 and is currently estimated at $156,453, approximately $105 per square foot. 404 E 7th St is a home located in Pike County with nearby schools including Waverly Primary School, Waverly Intermediate School, and Waverly Junior High School.
Ownership History
Date
Name
Owned For
Owner Type
Purchase Details
Closed on
May 14, 2024
Sold by
Fedell Anna and Boyer Ronnie
Bought by
Taphorn Llc
Current Estimated Value
Home Financials for this Owner
Home Financials are based on the most recent Mortgage that was taken out on this home.
Original Mortgage
$150,000
Outstanding Balance
$147,873
Interest Rate
6.82%
Mortgage Type
Credit Line Revolving
Estimated Equity
$8,580
Purchase Details
Closed on
Jun 23, 2006
Sold by
Boyer Ronnie Dale
Bought by
Boyer Ronnie Dale and Boyer Margie K
Home Financials for this Owner
Home Financials are based on the most recent Mortgage that was taken out on this home.
Original Mortgage
$22,000
Interest Rate
6.73%
Mortgage Type
Unknown
Create a Home Valuation Report for This Property
The Home Valuation Report is an in-depth analysis detailing your home's value as well as a comparison with similar homes in the area
Home Values in the Area
Average Home Value in this Area
Purchase History
| Date | Buyer | Sale Price | Title Company |
|---|---|---|---|
| Taphorn Llc | $93,075 | None Listed On Document | |
| Taphorn Llc | $93,075 | None Listed On Document | |
| Boyer Ronnie Dale | -- | None Available |
Source: Public Records
Mortgage History
| Date | Status | Borrower | Loan Amount |
|---|---|---|---|
| Open | Taphorn Llc | $150,000 | |
| Closed | Taphorn Llc | $150,000 | |
| Previous Owner | Boyer Ronnie Dale | $22,000 |
Source: Public Records
Tax History
| Year | Tax Paid | Tax Assessment Tax Assessment Total Assessment is a certain percentage of the fair market value that is determined by local assessors to be the total taxable value of land and additions on the property. | Land | Improvement |
|---|---|---|---|---|
| 2024 | $1,352 | $35,830 | $7,230 | $28,600 |
| 2023 | $1,301 | $35,830 | $7,230 | $28,600 |
| 2022 | $676 | $25,330 | $5,580 | $19,750 |
| 2021 | $663 | $25,330 | $5,580 | $19,750 |
| 2020 | $664 | $25,330 | $5,580 | $19,750 |
| 2019 | $513 | $21,470 | $4,730 | $16,740 |
| 2018 | $574 | $21,470 | $4,730 | $16,740 |
| 2017 | $724 | $29,280 | $4,730 | $24,550 |
| 2016 | $631 | $24,040 | $4,030 | $20,010 |
| 2015 | $631 | $24,040 | $4,030 | $20,010 |
| 2014 | $611 | $24,040 | $4,030 | $20,010 |
| 2013 | $619 | $24,040 | $4,030 | $20,010 |
| 2012 | $633 | $24,040 | $4,030 | $20,010 |
Source: Public Records
Map
Nearby Homes
Your Personal Tour Guide
Ask me questions while you tour the home.