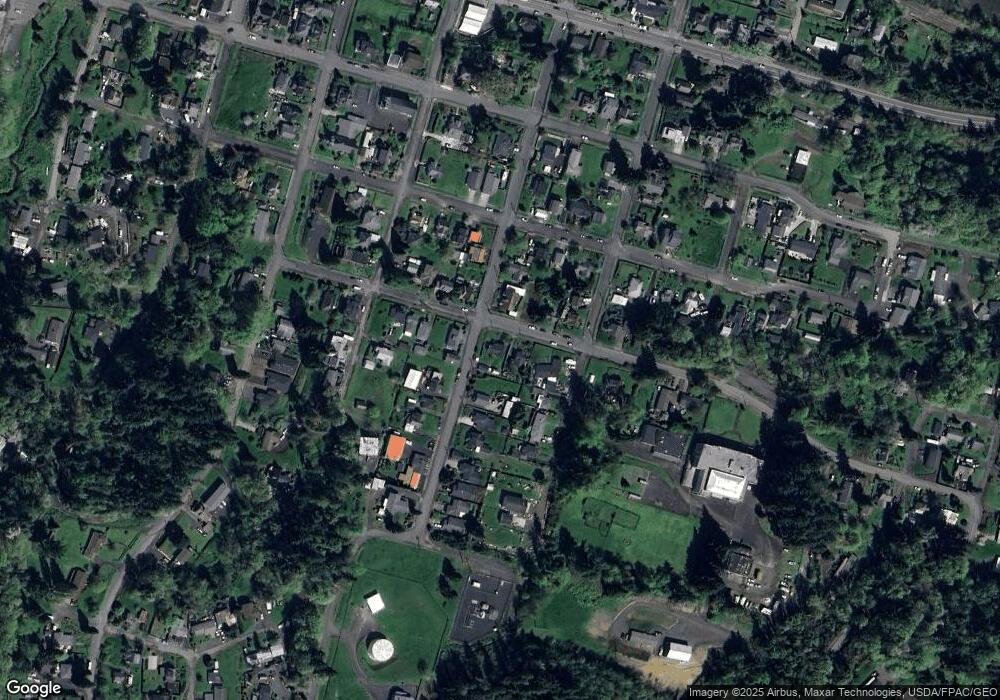
404 E E St Rainier, OR 97048
Estimated Value: $243,935 - $348,000
2
Beds
1
Bath
864
Sq Ft
$331/Sq Ft
Est. Value
About This Home
This home is located at 404 E E St, Rainier, OR 97048 and is currently estimated at $286,234, approximately $331 per square foot. 404 E E St is a home located in Columbia County with nearby schools including Hudson Park Elementary School, Rainier Junior/Senior High School, and North Columbia Academy.
Ownership History
Date
Name
Owned For
Owner Type
Purchase Details
Closed on
Jul 20, 2022
Sold by
Hermo Richard Jeffrey
Bought by
Hermo Richard Jeffrey and Hermo Asharea C
Current Estimated Value
Purchase Details
Closed on
May 11, 2022
Sold by
Brenda Cameron
Bought by
Hermo Richard Jeffrey
Purchase Details
Closed on
Aug 7, 2019
Sold by
Bakko Richard
Bought by
Hermo Richard Jeffrey
Purchase Details
Closed on
May 4, 2016
Sold by
County Of Columbia
Bought by
Bakko Richard and Cameron Brenda
Purchase Details
Closed on
Jun 9, 2004
Sold by
Estell Mable A
Bought by
Bakko Twyla C and Estell Mable A
Create a Home Valuation Report for This Property
The Home Valuation Report is an in-depth analysis detailing your home's value as well as a comparison with similar homes in the area
Purchase History
| Date | Buyer | Sale Price | Title Company |
|---|---|---|---|
| Hermo Richard Jeffrey | -- | None Listed On Document | |
| Hermo Richard Jeffrey | $101,000 | None Listed On Document | |
| Hermo Richard Jeffrey | -- | None Available | |
| Bakko Richard | $16,100 | None Available | |
| Bakko Twyla C | $25,000 | Ticor Title |
Source: Public Records
Tax History
| Year | Tax Paid | Tax Assessment Tax Assessment Total Assessment is a certain percentage of the fair market value that is determined by local assessors to be the total taxable value of land and additions on the property. | Land | Improvement |
|---|---|---|---|---|
| 2025 | $1,901 | $102,910 | $40,420 | $62,490 |
| 2024 | $1,856 | $99,920 | $39,240 | $60,680 |
| 2023 | $1,831 | $97,010 | $33,780 | $63,230 |
| 2022 | $1,748 | $94,190 | $32,550 | $61,640 |
| 2021 | $1,720 | $91,450 | $34,210 | $57,240 |
| 2020 | $1,671 | $88,790 | $31,860 | $56,930 |
| 2019 | $1,645 | $86,210 | $31,450 | $54,760 |
| 2018 | $1,607 | $83,700 | $45,560 | $38,140 |
| 2017 | $1,592 | $81,270 | $44,230 | $37,040 |
| 2016 | $1,547 | $78,910 | $42,940 | $35,970 |
| 2015 | $1,316 | $75,010 | $39,510 | $35,500 |
| 2014 | $1,253 | $71,530 | $39,440 | $32,090 |
Source: Public Records
Map
Nearby Homes
Your Personal Tour Guide
Ask me questions while you tour the home.