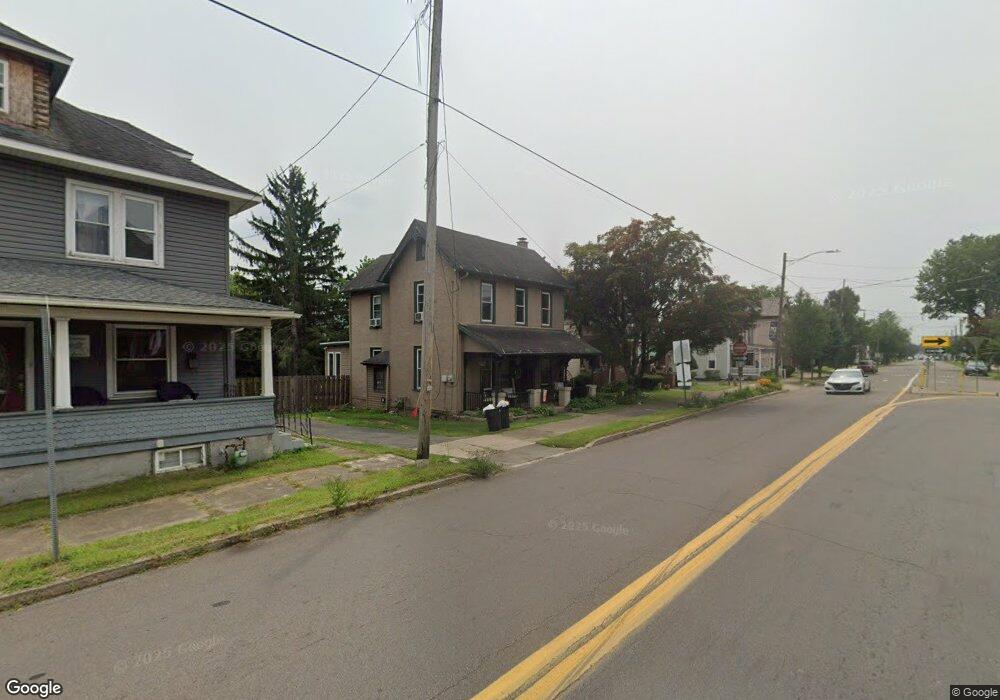
404 E Front St Berwick, PA 18603
Estimated Value: $110,000 - $211,000
3
Beds
1
Bath
1,542
Sq Ft
$116/Sq Ft
Est. Value
About This Home
This home is located at 404 E Front St, Berwick, PA 18603 and is currently estimated at $179,425, approximately $116 per square foot. 404 E Front St is a home located in Luzerne County with nearby schools including Berwick Area High School, Holy Family Consolidated School, and New Story School.
Ownership History
Date
Name
Owned For
Owner Type
Purchase Details
Closed on
Dec 10, 2021
Sold by
Us Bank Trust National Association
Bought by
Mccabe Max
Current Estimated Value
Home Financials for this Owner
Home Financials are based on the most recent Mortgage that was taken out on this home.
Original Mortgage
$72,200
Outstanding Balance
$65,590
Interest Rate
2.98%
Mortgage Type
Commercial
Estimated Equity
$113,835
Purchase Details
Closed on
Dec 2, 2021
Sold by
Vrmtg Asset Trust
Bought by
Mccabe Max
Home Financials for this Owner
Home Financials are based on the most recent Mortgage that was taken out on this home.
Original Mortgage
$72,200
Outstanding Balance
$65,590
Interest Rate
2.98%
Mortgage Type
Commercial
Estimated Equity
$113,835
Purchase Details
Closed on
Sep 22, 2021
Sold by
Tyson Amanda S and Tyson Amanda
Bought by
U S Bank Trust Nationalassociation and Vrmtg Asset Trust
Purchase Details
Closed on
Jan 6, 2006
Sold by
Koch Martin N
Bought by
Tyson Amanda S
Home Financials for this Owner
Home Financials are based on the most recent Mortgage that was taken out on this home.
Original Mortgage
$84,333
Interest Rate
6.34%
Mortgage Type
FHA
Create a Home Valuation Report for This Property
The Home Valuation Report is an in-depth analysis detailing your home's value as well as a comparison with similar homes in the area
Home Values in the Area
Average Home Value in this Area
Purchase History
| Date | Buyer | Sale Price | Title Company |
|---|---|---|---|
| Mccabe Max | $76,000 | None Available | |
| Mccabe Max | $76,000 | None Listed On Document | |
| U S Bank Trust Nationalassociation | $1,591 | None Available | |
| Tyson Amanda S | $85,000 | None Available |
Source: Public Records
Mortgage History
| Date | Status | Borrower | Loan Amount |
|---|---|---|---|
| Open | Mccabe Max | $72,200 | |
| Closed | Mccabe Max | $72,200 | |
| Previous Owner | Tyson Amanda S | $84,333 |
Source: Public Records
Tax History
| Year | Tax Paid | Tax Assessment Tax Assessment Total Assessment is a certain percentage of the fair market value that is determined by local assessors to be the total taxable value of land and additions on the property. | Land | Improvement |
|---|---|---|---|---|
| 2026 | $2,370 | $103,800 | $40,500 | $63,300 |
| 2025 | $2,338 | $103,800 | $40,500 | $63,300 |
| 2024 | $2,267 | $103,800 | $40,500 | $63,300 |
| 2023 | $2,177 | $103,800 | $40,500 | $63,300 |
| 2022 | $2,158 | $103,800 | $40,500 | $63,300 |
| 2021 | $2,158 | $103,800 | $40,500 | $63,300 |
| 2020 | $1,864 | $103,800 | $40,500 | $63,300 |
| 2019 | $1,850 | $103,800 | $40,500 | $63,300 |
| 2018 | $1,837 | $103,800 | $40,500 | $63,300 |
| 2017 | $1,921 | $103,800 | $40,500 | $63,300 |
| 2016 | -- | $103,800 | $40,500 | $63,300 |
| 2015 | $1,485 | $103,800 | $40,500 | $63,300 |
| 2014 | $1,485 | $103,800 | $40,500 | $63,300 |
Source: Public Records
Map
Nearby Homes
Your Personal Tour Guide
Ask me questions while you tour the home.