404 E Main St Greenfield, IN 46140
Greenfield AreaEstimated Value: $126,000 - $266,000
About This Home
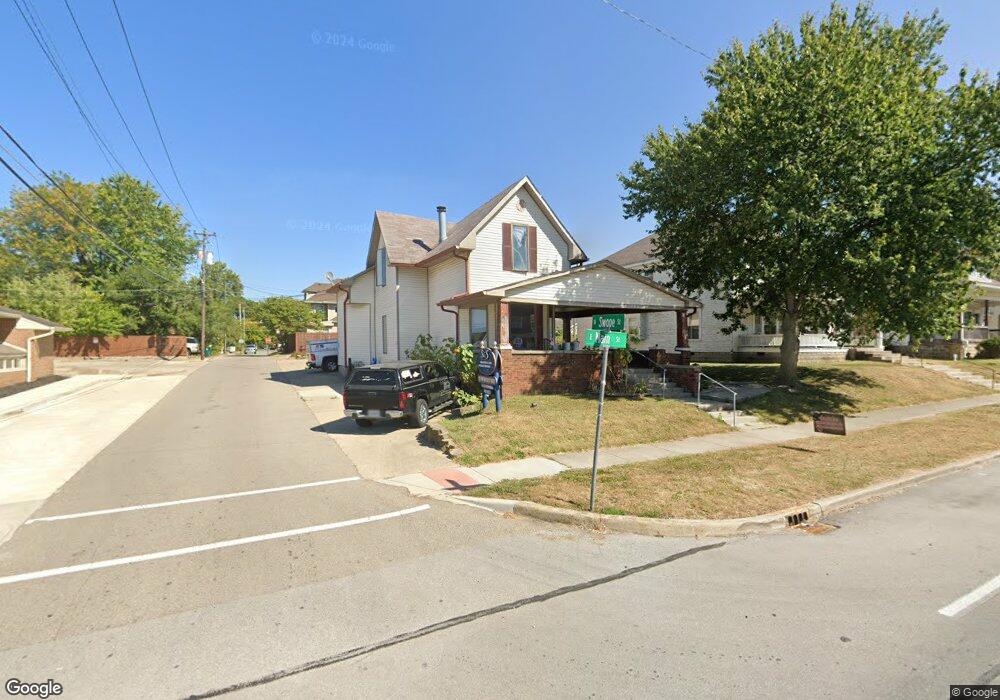
This home is located at 404 E Main St, Greenfield, IN 46140 and is currently estimated at $197,299, approximately $92 per square foot. 404 E Main St is a home located in Hancock County with nearby schools including Greenfield Intermediate School, Harris Elementary School, and Greenfield Central Junior High School.
Ownership History
We collect this data history from publicly available records. To have your information removed, we recommend requesting removal directly through your county’s website.
Purchase Details
Home Financials for this Owner
Home Financials are based on the most recent Mortgage that was taken out on this home.Home Values in the Area
Average Home Value in this Area
Purchase History
We collect this data history from publicly available records. To have your information removed, we recommend requesting removal directly through your county’s website.
| Date | Buyer | Sale Price | Title Company |
|---|---|---|---|
| -- | None Available |
Mortgage History
We collect this data history from publicly available records. To have your information removed, we recommend requesting removal directly through your county’s website.
| Date | Status | Borrower | Loan Amount |
|---|---|---|---|
| Open | $250,000 | ||
| Previous Owner | $234,000 | ||
| Previous Owner | $40,000 | ||
| Previous Owner | $200,000 | ||
| Previous Owner | $200,000 | ||
| Previous Owner | $48,000 | ||
| Previous Owner | $150,000 |
Tax History
We collect this data history from publicly available records. To have your information removed, we recommend requesting removal directly through your county’s website.
| Year | Tax Paid | Tax Assessment Tax Assessment Total Assessment is a certain percentage of the fair market value that is determined by local assessors to be the total taxable value of land and additions on the property. | Land | Improvement |
|---|---|---|---|---|
| 2025 | $4,286 | $206,300 | $40,000 | $166,300 |
| 2024 | $4,268 | $209,300 | $40,000 | $169,300 |
| 2023 | $6,446 | $193,900 | $40,000 | $153,900 |
| 2022 | $3,364 | $164,000 | $28,600 | $135,400 |
| 2021 | $2,754 | $129,500 | $28,600 | $100,900 |
| 2020 | $2,628 | $120,800 | $28,600 | $92,200 |
| 2019 | $2,550 | $115,700 | $28,600 | $87,100 |
| 2018 | $2,556 | $115,600 | $28,600 | $87,000 |
| 2017 | $2,470 | $108,400 | $28,600 | $79,800 |
| 2016 | $2,577 | $107,300 | $28,300 | $79,000 |
| 2014 | $2,454 | $101,800 | $27,200 | $74,600 |
| 2013 | $2,454 | $101,800 | $27,200 | $74,600 |
Map
- 403 E North St
- 14 Wood St
- 104 E North St
- 125 Baldwin St
- 308 Baldwin St
- 0 S State St Unit MBR22005177
- 29 Howard St
- 222 Douglas St
- 225 S State St
- 209 N Pennsylvania St
- 3840 U S 40
- 518 N State St
- 528 N State St
- 921 E Main St
- 629 N East St
- 406 Mount St
- 621 N State St
- 239 W South St
- 618 N State St
- 325 W Main St
Ask me questions while you tour the home.