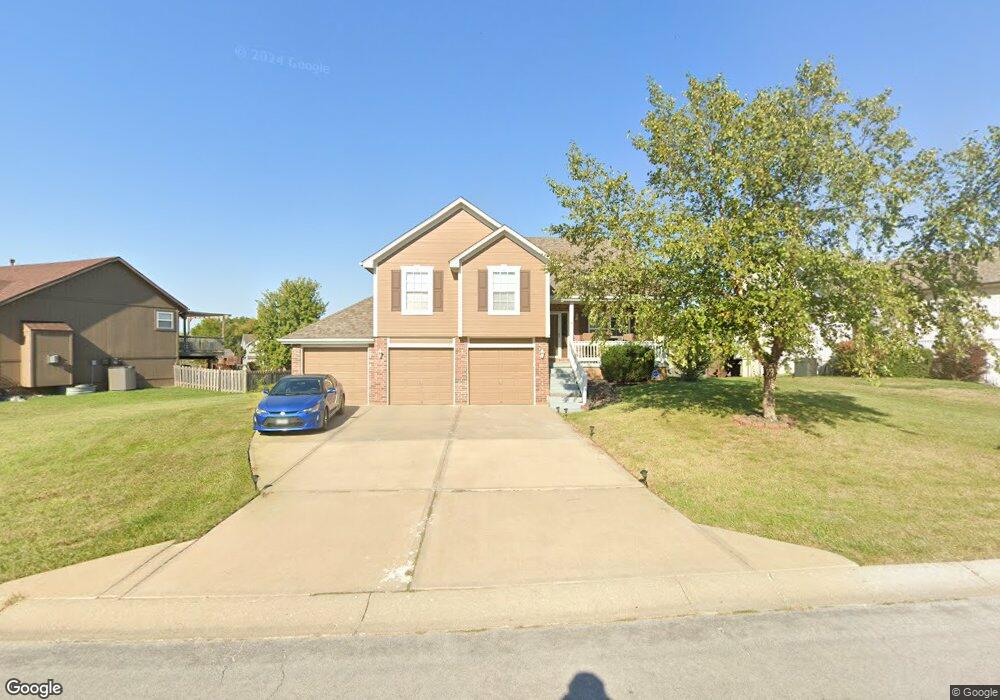
404 Eagle Glen Dr Raymore, MO 64083
Estimated Value: $373,000 - $394,000
4
Beds
3
Baths
1,560
Sq Ft
$246/Sq Ft
Est. Value
About This Home
This home is located at 404 Eagle Glen Dr, Raymore, MO 64083 and is currently estimated at $383,615, approximately $245 per square foot. 404 Eagle Glen Dr is a home located in Cass County with nearby schools including Eagle Glen Intermediate School, Raymore-Peculiar East Middle School, and Raymore-Peculiar Senior High School.
Ownership History
Date
Name
Owned For
Owner Type
Purchase Details
Closed on
Feb 16, 2011
Sold by
Fannie Mae
Bought by
Porter Maryetta
Current Estimated Value
Home Financials for this Owner
Home Financials are based on the most recent Mortgage that was taken out on this home.
Original Mortgage
$141,324
Outstanding Balance
$96,040
Interest Rate
4.79%
Mortgage Type
FHA
Estimated Equity
$287,575
Purchase Details
Closed on
Aug 20, 2010
Sold by
Norman Angela
Bought by
Federal National Mortgage Association
Purchase Details
Closed on
Aug 29, 2006
Sold by
Barrington Enterprises Llc
Bought by
Norman Angela
Home Financials for this Owner
Home Financials are based on the most recent Mortgage that was taken out on this home.
Original Mortgage
$204,900
Interest Rate
6.72%
Mortgage Type
New Conventional
Create a Home Valuation Report for This Property
The Home Valuation Report is an in-depth analysis detailing your home's value as well as a comparison with similar homes in the area
Home Values in the Area
Average Home Value in this Area
Purchase History
| Date | Buyer | Sale Price | Title Company |
|---|---|---|---|
| Porter Maryetta | -- | -- | |
| Federal National Mortgage Association | $228,806 | -- | |
| Norman Angela | -- | -- | |
| Barrington Enterpries Llc | -- | -- |
Source: Public Records
Mortgage History
| Date | Status | Borrower | Loan Amount |
|---|---|---|---|
| Open | Porter Maryetta | $141,324 | |
| Previous Owner | Norman Angela | $204,900 |
Source: Public Records
Tax History
| Year | Tax Paid | Tax Assessment Tax Assessment Total Assessment is a certain percentage of the fair market value that is determined by local assessors to be the total taxable value of land and additions on the property. | Land | Improvement |
|---|---|---|---|---|
| 2025 | $4,065 | $56,420 | $8,590 | $47,830 |
| 2024 | $4,065 | $49,950 | $7,810 | $42,140 |
| 2023 | $4,060 | $49,950 | $7,810 | $42,140 |
| 2022 | $3,628 | $44,340 | $7,810 | $36,530 |
| 2021 | $3,628 | $44,340 | $7,810 | $36,530 |
| 2020 | $3,605 | $43,280 | $7,810 | $35,470 |
| 2019 | $3,480 | $43,280 | $7,810 | $35,470 |
| 2018 | $3,168 | $38,050 | $6,640 | $31,410 |
| 2017 | $2,916 | $38,050 | $6,640 | $31,410 |
| 2016 | $2,916 | $36,350 | $6,640 | $29,710 |
| 2015 | $2,918 | $36,350 | $6,640 | $29,710 |
| 2014 | $2,919 | $36,350 | $6,640 | $29,710 |
| 2013 | -- | $36,350 | $6,640 | $29,710 |
Source: Public Records
Map
Nearby Homes
- 411 Eagle Glen Dr
- 414 Eagle Glen Dr
- 1608 Cody Dr
- 112 S Westglen Dr
- 110 S Westglen Dr
- 1601 Stasi Ave
- 212 S Huntsman Blvd
- 603 Old Paint Rd
- 113 N Eastglen Dr
- 1510 Colt Cir
- 415 Woodview Dr
- 1108 Yokley Dr
- 1519 Colt Cir
- 1105 Brookside Place
- 0 Scott Dr
- 215 Scott Dr
- 201 Johnston Dr
- 105 N Landcaster Dr
- 1105 Creekside Ct
- 300 Dean Ave
- 402 Eagle Glen Dr
- 406 Eagle Glen Dr
- 293 Cove Cir
- 295 Cove Cir
- 400 Eagle Glen Dr
- 408 Eagle Glen Dr
- 407 Eagle Glen Dr
- 409 Eagle Glen Dr
- 405 Eagle Glen Dr
- 403 Eagle Glen Dr
- 0 Eagle Glen Dr Unit 2089009
- 291 Cove Cir
- 320 Eagle Glen Dr
- 401 Eagle Glen Dr
- 413 Eagle Glen Dr
- 1509 Ensley Cir
- 325 Eagle Glen Dr
- 318 Eagle Glen Dr
- 296 Cove Cir
Your Personal Tour Guide
Ask me questions while you tour the home.