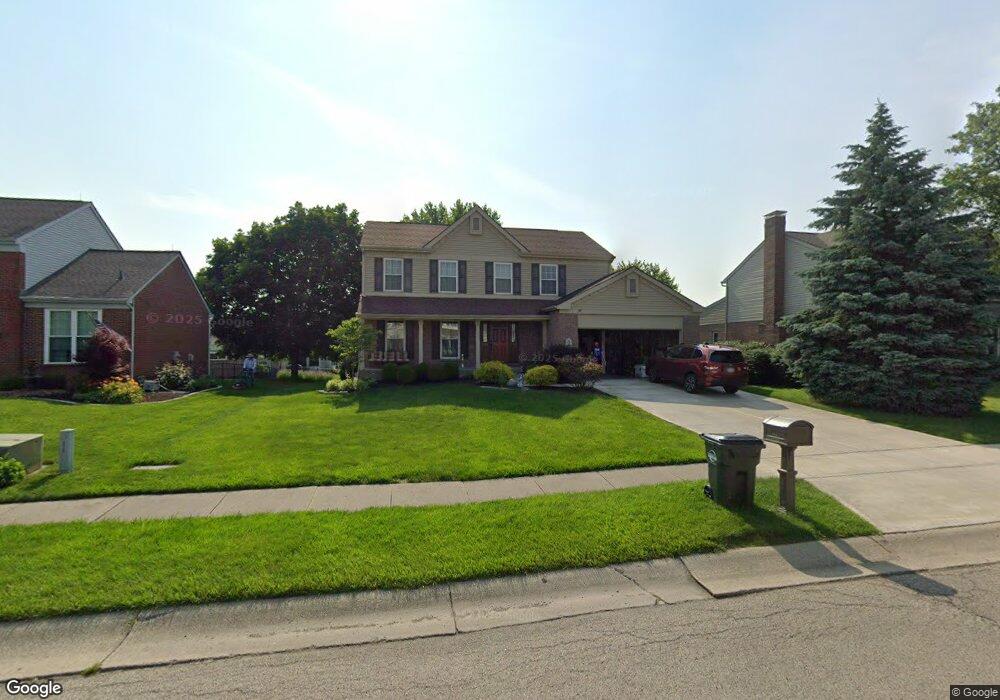
404 Eagleview Way Cincinnati, OH 45215
Estimated Value: $350,000 - $404,000
4
Beds
3
Baths
1,861
Sq Ft
$201/Sq Ft
Est. Value
About This Home
This home is located at 404 Eagleview Way, Cincinnati, OH 45215 and is currently estimated at $373,876, approximately $200 per square foot. 404 Eagleview Way is a home located in Hamilton County with nearby schools including Reading Community High School, Saints Peter and Paul Academy, and Mount Notre Dame High School.
Ownership History
Date
Name
Owned For
Owner Type
Purchase Details
Closed on
Sep 24, 2001
Sold by
Stevenson David T and Stevenson Karen P
Bought by
Stevenson Karen P and Stevenson David T
Current Estimated Value
Purchase Details
Closed on
May 21, 2001
Sold by
Stevenson David T and Stevenson Karen P
Bought by
Stevenson Karen P and Stevenson David T
Purchase Details
Closed on
May 28, 1997
Sold by
Hillard F Brian and Hillard Patricia Ann
Bought by
Stevenson David T and Stevenson Karen P
Home Financials for this Owner
Home Financials are based on the most recent Mortgage that was taken out on this home.
Original Mortgage
$126,500
Interest Rate
8.17%
Purchase Details
Closed on
Dec 15, 1993
Sold by
The Drees Company
Bought by
Hillard F Brian and Hillard Patricia Ann
Home Financials for this Owner
Home Financials are based on the most recent Mortgage that was taken out on this home.
Original Mortgage
$141,900
Interest Rate
7.35%
Create a Home Valuation Report for This Property
The Home Valuation Report is an in-depth analysis detailing your home's value as well as a comparison with similar homes in the area
Home Values in the Area
Average Home Value in this Area
Purchase History
| Date | Buyer | Sale Price | Title Company |
|---|---|---|---|
| Stevenson Karen P | -- | -- | |
| Stevenson David T | -- | -- | |
| Stevenson Karen P | -- | -- | |
| Stevenson David T | $176,500 | -- | |
| Hillard F Brian | -- | -- |
Source: Public Records
Mortgage History
| Date | Status | Borrower | Loan Amount |
|---|---|---|---|
| Closed | Stevenson David T | $126,500 | |
| Previous Owner | Hillard F Brian | $141,900 |
Source: Public Records
Tax History
| Year | Tax Paid | Tax Assessment Tax Assessment Total Assessment is a certain percentage of the fair market value that is determined by local assessors to be the total taxable value of land and additions on the property. | Land | Improvement |
|---|---|---|---|---|
| 2025 | $5,494 | $103,646 | $14,802 | $88,844 |
| 2023 | $5,445 | $103,646 | $14,802 | $88,844 |
| 2022 | $5,183 | $76,441 | $12,849 | $63,592 |
| 2021 | $4,326 | $76,441 | $12,849 | $63,592 |
| 2020 | $4,373 | $76,441 | $12,849 | $63,592 |
| 2019 | $4,238 | $67,649 | $11,372 | $56,277 |
| 2018 | $4,243 | $67,649 | $11,372 | $56,277 |
| 2017 | $3,998 | $67,649 | $11,372 | $56,277 |
| 2016 | $3,972 | $67,417 | $11,144 | $56,273 |
| 2015 | $4,007 | $67,417 | $11,144 | $56,273 |
| 2014 | $3,506 | $67,417 | $11,144 | $56,273 |
| 2013 | $3,554 | $68,793 | $11,372 | $57,421 |
Source: Public Records
Map
Nearby Homes
- 300 Rainbow Ridge
- 301 Breezy Vista
- 304 Rainbow Ridge
- 305 Breezy Vista
- 405 Eagleview Way
- 308 Rainbow Ridge
- 225 Breezy Vista
- 216 Rainbow Ridge
- 309 Breezy Vista
- 312 Eagleview Way
- 301 Rainbow Ridge
- 305 Rainbow Ridge
- 221 Rainbow Ridge
- 212 Rainbow Ridge
- 221 Breezy Vista
- 312 Rainbow Ridge
- 313 Breezy Vista
- 304 Breezy Vista
- 309 Rainbow Ridge
- 217 Rainbow Ridge
Your Personal Tour Guide
Ask me questions while you tour the home.