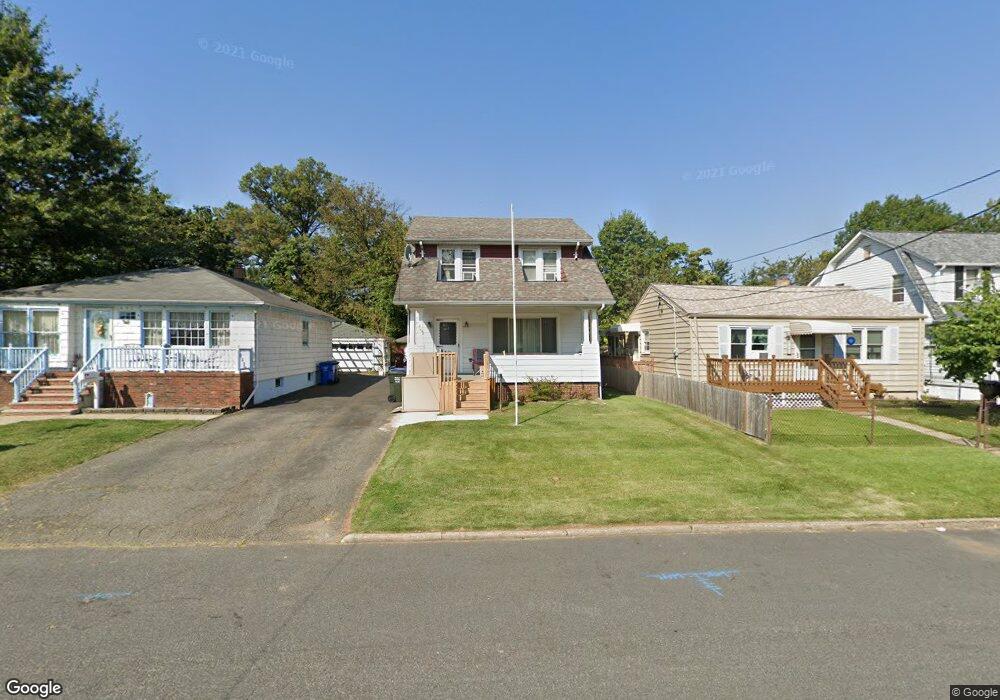
404 East Ave Sewaren, NJ 07077
Estimated Value: $326,127 - $484,000
3
Beds
1
Bath
1,194
Sq Ft
$359/Sq Ft
Est. Value
About This Home
This home is located at 404 East Ave, Sewaren, NJ 07077 and is currently estimated at $428,782, approximately $359 per square foot. 404 East Ave is a home located in Middlesex County with nearby schools including Matthew Jago Elementary School, Avenel Middle School, and Woodbridge High School.
Ownership History
Date
Name
Owned For
Owner Type
Purchase Details
Closed on
May 21, 2020
Sold by
Brockup Maureen and Brockup Dawn R
Bought by
Caquias Ana Maria
Current Estimated Value
Home Financials for this Owner
Home Financials are based on the most recent Mortgage that was taken out on this home.
Original Mortgage
$265,109
Outstanding Balance
$234,479
Interest Rate
3.2%
Mortgage Type
New Conventional
Estimated Equity
$194,303
Purchase Details
Closed on
Dec 13, 1962
Bought by
Brockup Arthur and Brockup Maureen
Create a Home Valuation Report for This Property
The Home Valuation Report is an in-depth analysis detailing your home's value as well as a comparison with similar homes in the area
Home Values in the Area
Average Home Value in this Area
Purchase History
| Date | Buyer | Sale Price | Title Company |
|---|---|---|---|
| Caquias Ana Maria | $270,000 | Prestige Title Agency Nos | |
| Brockup Arthur | -- | -- |
Source: Public Records
Mortgage History
| Date | Status | Borrower | Loan Amount |
|---|---|---|---|
| Open | Caquias Ana Maria | $265,109 |
Source: Public Records
Tax History
| Year | Tax Paid | Tax Assessment Tax Assessment Total Assessment is a certain percentage of the fair market value that is determined by local assessors to be the total taxable value of land and additions on the property. | Land | Improvement |
|---|---|---|---|---|
| 2025 | $7,201 | $53,200 | $13,600 | $39,600 |
| 2024 | $7,022 | $53,200 | $13,600 | $39,600 |
Source: Public Records
Map
Nearby Homes
Your Personal Tour Guide
Ask me questions while you tour the home.