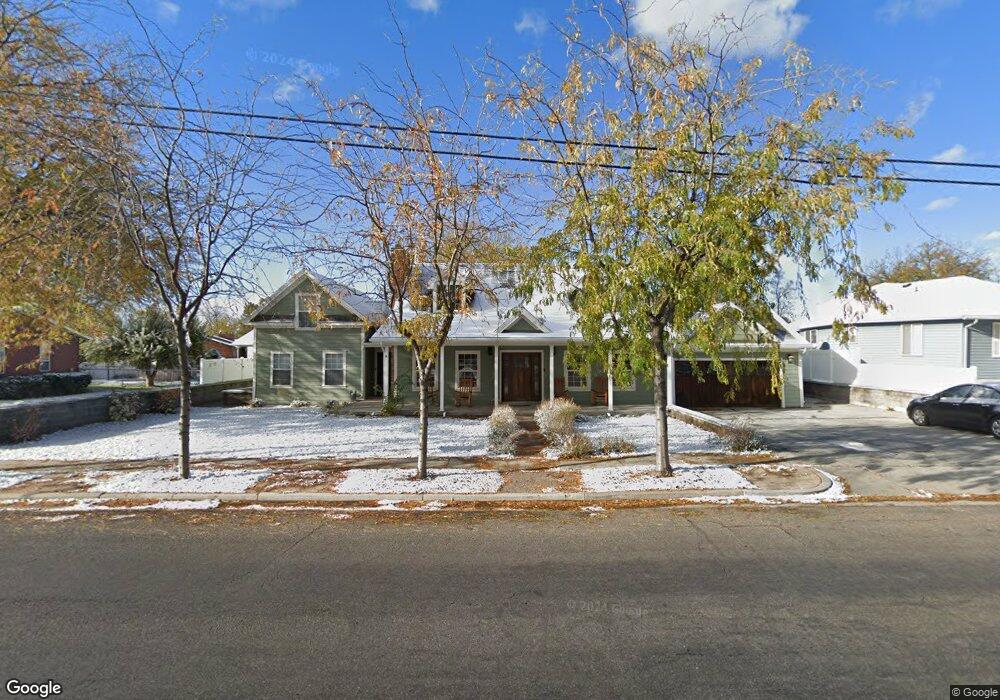
404 Flint St Layton, UT 84041
Estimated Value: $653,000 - $884,000
5
Beds
4
Baths
3,066
Sq Ft
$239/Sq Ft
Est. Value
About This Home
This home is located at 404 Flint St, Layton, UT 84041 and is currently estimated at $731,242, approximately $238 per square foot. 404 Flint St is a home located in Davis County with nearby schools including Layton Elementary School, Fairfield Junior High School, and Layton High School.
Ownership History
Date
Name
Owned For
Owner Type
Purchase Details
Closed on
Mar 15, 2021
Sold by
Bute Alan and Bute Jo Ann
Bought by
Rentz Torrey and Rentz Wendy
Current Estimated Value
Home Financials for this Owner
Home Financials are based on the most recent Mortgage that was taken out on this home.
Original Mortgage
$565,000
Outstanding Balance
$505,330
Interest Rate
2.7%
Mortgage Type
Commercial
Estimated Equity
$225,912
Purchase Details
Closed on
Jun 1, 2003
Sold by
Bute Alan R and Bute Jo Ann T
Bought by
Bute Alan and Bute Jo Ann
Purchase Details
Closed on
Jan 22, 1996
Sold by
Bute Alan R and Bute Joann T
Bought by
Bute Alan R and Bute Jo Ann T
Create a Home Valuation Report for This Property
The Home Valuation Report is an in-depth analysis detailing your home's value as well as a comparison with similar homes in the area
Home Values in the Area
Average Home Value in this Area
Purchase History
| Date | Buyer | Sale Price | Title Company |
|---|---|---|---|
| Rentz Torrey | -- | First American Title | |
| Bute Alan | -- | -- | |
| Bute Alan R | -- | Blacks Title Inc |
Source: Public Records
Mortgage History
| Date | Status | Borrower | Loan Amount |
|---|---|---|---|
| Open | Rentz Torrey | $565,000 |
Source: Public Records
Tax History
| Year | Tax Paid | Tax Assessment Tax Assessment Total Assessment is a certain percentage of the fair market value that is determined by local assessors to be the total taxable value of land and additions on the property. | Land | Improvement |
|---|---|---|---|---|
| 2025 | $3,338 | $350,350 | $108,106 | $242,244 |
| 2024 | $3,136 | $331,650 | $130,898 | $200,752 |
| 2023 | $3,047 | $568,000 | $133,505 | $434,495 |
| 2022 | $3,217 | $325,600 | $80,810 | $244,790 |
| 2021 | $2,769 | $418,000 | $121,221 | $296,779 |
| 2020 | $2,196 | $318,000 | $102,689 | $215,311 |
| 2019 | $2,073 | $294,000 | $103,714 | $190,286 |
| 2018 | $1,889 | $269,000 | $91,147 | $177,853 |
| 2016 | $1,835 | $134,805 | $36,650 | $98,155 |
| 2015 | $1,820 | $126,940 | $36,650 | $90,290 |
| 2014 | $1,996 | $142,330 | $36,650 | $105,680 |
| 2013 | -- | $112,002 | $22,756 | $89,246 |
Source: Public Records
Map
Nearby Homes
Your Personal Tour Guide
Ask me questions while you tour the home.