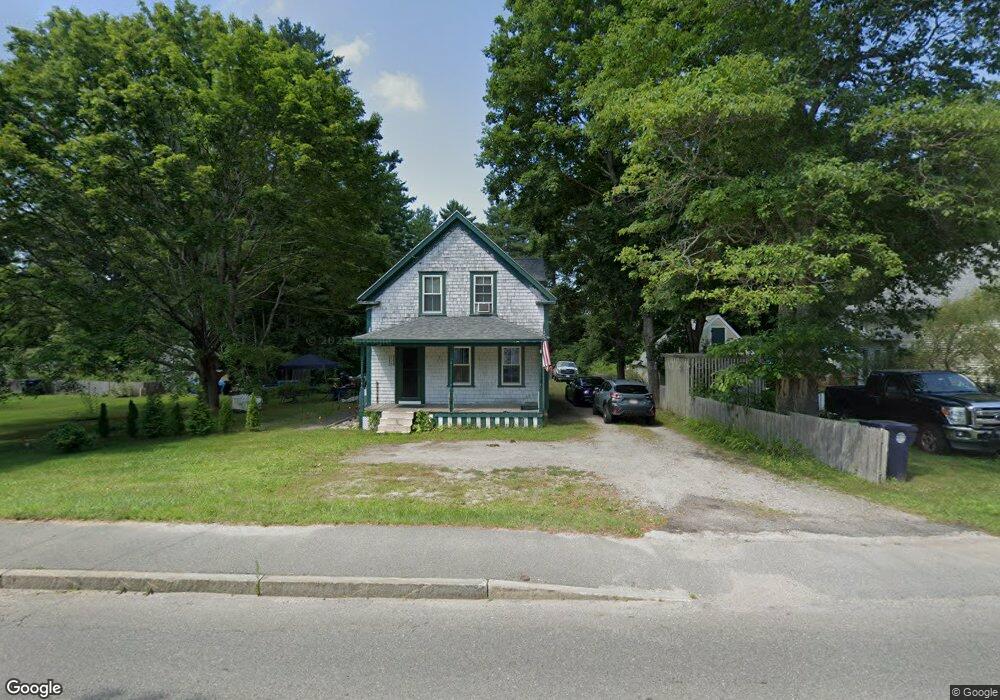
404 Front St Marion, MA 02738
Estimated Value: $508,403 - $653,000
4
Beds
2
Baths
1,509
Sq Ft
$369/Sq Ft
Est. Value
About This Home
This home is located at 404 Front St, Marion, MA 02738 and is currently estimated at $556,351, approximately $368 per square foot. 404 Front St is a home located in Plymouth County with nearby schools including Old Rochester Regional High School and Tabor Academy.
Ownership History
Date
Name
Owned For
Owner Type
Purchase Details
Closed on
Jul 16, 2003
Sold by
Norcross Aaron
Bought by
Norcross Aaron and Norcross Tina
Current Estimated Value
Purchase Details
Closed on
Jun 27, 2000
Sold by
Wilson Josephine M
Bought by
Norcross Aaron
Purchase Details
Closed on
Jun 23, 1995
Sold by
Buckley Jean M
Bought by
Wilkson Josephine M
Create a Home Valuation Report for This Property
The Home Valuation Report is an in-depth analysis detailing your home's value as well as a comparison with similar homes in the area
Purchase History
| Date | Buyer | Sale Price | Title Company |
|---|---|---|---|
| Norcross Aaron | -- | -- | |
| Norcross Aaron | $136,000 | -- | |
| Wilkson Josephine M | $93,500 | -- |
Source: Public Records
Mortgage History
| Date | Status | Borrower | Loan Amount |
|---|---|---|---|
| Open | Wilkson Josephine M | $25,000 | |
| Open | Wilkson Josephine M | $212,000 |
Source: Public Records
Tax History
| Year | Tax Paid | Tax Assessment Tax Assessment Total Assessment is a certain percentage of the fair market value that is determined by local assessors to be the total taxable value of land and additions on the property. | Land | Improvement |
|---|---|---|---|---|
| 2025 | $3,240 | $347,600 | $176,900 | $170,700 |
| 2024 | $2,766 | $298,700 | $154,800 | $143,900 |
| 2023 | $3,359 | $355,800 | $221,200 | $134,600 |
| 2022 | $3,037 | $279,900 | $136,100 | $143,800 |
| 2021 | $4,826 | $252,600 | $115,400 | $137,200 |
| 2020 | $2,735 | $233,800 | $115,400 | $118,400 |
| 2019 | $4,581 | $233,800 | $115,400 | $118,400 |
| 2018 | $2,564 | $223,900 | $114,200 | $109,700 |
| 2017 | $2,555 | $223,900 | $114,200 | $109,700 |
| 2016 | $2,485 | $219,700 | $114,200 | $105,500 |
| 2015 | $2,673 | $240,600 | $120,700 | $119,900 |
Source: Public Records
Map
Nearby Homes
Your Personal Tour Guide
Ask me questions while you tour the home.