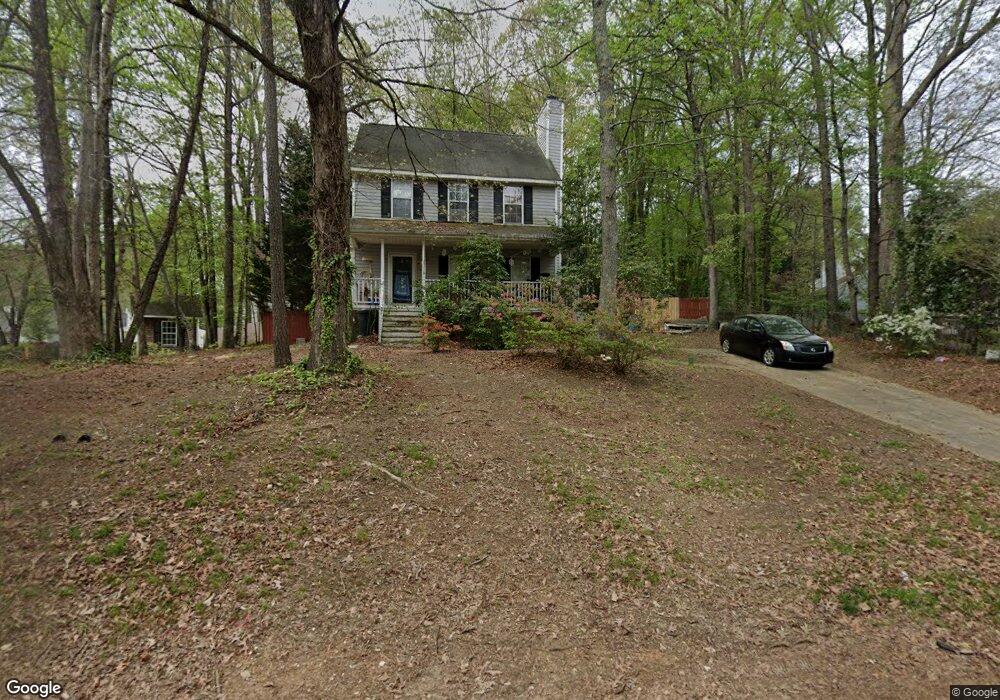
404 Indian Hill Rd Holly Springs, NC 27540
Estimated Value: $346,000 - $384,000
3
Beds
3
Baths
1,362
Sq Ft
$266/Sq Ft
Est. Value
About This Home
This home is located at 404 Indian Hill Rd, Holly Springs, NC 27540 and is currently estimated at $361,947, approximately $265 per square foot. 404 Indian Hill Rd is a home located in Wake County with nearby schools including Holly Springs Elementary School, Holly Ridge Middle School, and Holly Springs High School.
Ownership History
Date
Name
Owned For
Owner Type
Purchase Details
Closed on
May 25, 2007
Sold by
Belcher Melinda S
Bought by
Carballal Marco Antonio Palacios and Trexler Elizabeth Irene
Current Estimated Value
Home Financials for this Owner
Home Financials are based on the most recent Mortgage that was taken out on this home.
Original Mortgage
$148,000
Outstanding Balance
$89,778
Interest Rate
6.12%
Mortgage Type
Purchase Money Mortgage
Estimated Equity
$272,169
Purchase Details
Closed on
Apr 1, 2004
Sold by
Olesen Keith R and Olesen Alycia Beverley
Bought by
Belcher Melinda S
Home Financials for this Owner
Home Financials are based on the most recent Mortgage that was taken out on this home.
Original Mortgage
$122,035
Interest Rate
5.53%
Mortgage Type
FHA
Create a Home Valuation Report for This Property
The Home Valuation Report is an in-depth analysis detailing your home's value as well as a comparison with similar homes in the area
Home Values in the Area
Average Home Value in this Area
Purchase History
| Date | Buyer | Sale Price | Title Company |
|---|---|---|---|
| Carballal Marco Antonio Palacios | $148,000 | None Available | |
| Belcher Melinda S | $123,000 | -- |
Source: Public Records
Mortgage History
| Date | Status | Borrower | Loan Amount |
|---|---|---|---|
| Open | Carballal Marco Antonio Palacios | $148,000 | |
| Previous Owner | Belcher Melinda S | $122,035 |
Source: Public Records
Tax History Compared to Growth
Tax History
| Year | Tax Paid | Tax Assessment Tax Assessment Total Assessment is a certain percentage of the fair market value that is determined by local assessors to be the total taxable value of land and additions on the property. | Land | Improvement |
|---|---|---|---|---|
| 2025 | $3,012 | $347,608 | $130,000 | $217,608 |
| 2024 | $2,999 | $347,608 | $130,000 | $217,608 |
| 2023 | $2,363 | $217,201 | $70,000 | $147,201 |
| 2022 | $2,281 | $217,201 | $70,000 | $147,201 |
| 2021 | $2,239 | $217,201 | $70,000 | $147,201 |
| 2020 | $2,239 | $217,201 | $70,000 | $147,201 |
| 2019 | $1,975 | $162,523 | $50,000 | $112,523 |
| 2018 | $1,786 | $162,523 | $50,000 | $112,523 |
| 2017 | $1,722 | $162,523 | $50,000 | $112,523 |
| 2016 | $1,699 | $162,523 | $50,000 | $112,523 |
| 2015 | $1,559 | $146,673 | $38,000 | $108,673 |
| 2014 | $1,506 | $146,673 | $38,000 | $108,673 |
Source: Public Records
Map
Nearby Homes
- 421 Grigsby Ave
- 401 Vista Springs Cir
- 144 Holly Mountain Rd
- 308 E Maple Ave
- 137 Lacombe Ct
- 109 Lacombe Ct
- 220 Avent Ferry Rd
- 705 Morton Farm Rd
- 717 Utley St
- 417 Prince Dr
- 413 Rhamkatte Rd
- 217 Jones Hill Rd
- 208 Old Ride Dr
- 225 Old Ride Dr
- 225 Seneca Shore Dr
- 0 Old Ride Dr
- 504 Prince Dr
- 4014 Kentworth Dr
- 141 Spring Pine Ln
- 404 Prince Dr
- 337 Wolfbridge Rd
- 408 Indian Hill Rd
- 341 Wolfbridge Rd
- 508 Baygall Rd
- 504 Baygall Rd
- 405 Indian Hill Rd
- 333 Wolfbridge Rd
- 512 Baygall Rd
- 409 Indian Hill Rd
- 401 Wolfbridge Rd
- 324 Wolfbridge Rd
- 501 Baygall Rd
- 200 Bateau Rd
- 320 Wolfbridge Rd
- 505 Baygall Rd
- 516 Baygall Rd
- 413 Indian Hill Rd
- 204 Bateau Rd
- 509 Baygall Rd
- 416 Indian Hill Rd