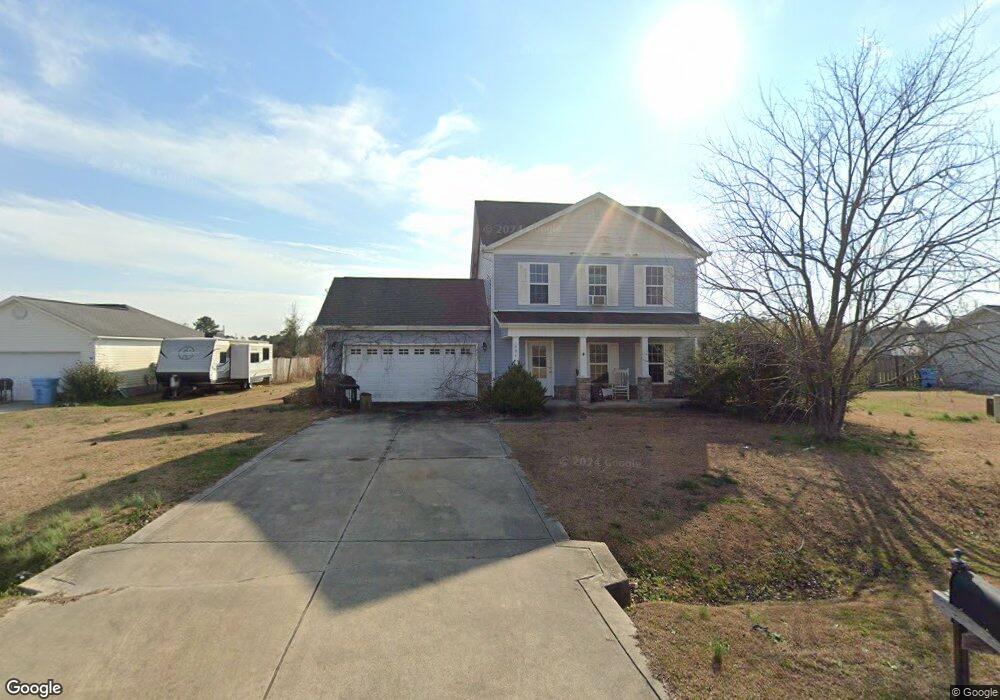
404 Jessica Ct Richlands, NC 28574
Estimated Value: $260,000 - $273,964
3
Beds
2
Baths
1,456
Sq Ft
$183/Sq Ft
Est. Value
About This Home
This home is located at 404 Jessica Ct, Richlands, NC 28574 and is currently estimated at $265,991, approximately $182 per square foot. 404 Jessica Ct is a home located in Onslow County with nearby schools including Richlands Elementary School, Trexler Middle School, and Richlands High School.
Ownership History
Date
Name
Owned For
Owner Type
Purchase Details
Closed on
Aug 15, 2021
Sold by
Bose Brittany A and Ritchie Brittany
Bought by
Bose Allen Steven
Current Estimated Value
Purchase Details
Closed on
Jul 17, 2012
Sold by
Slemp William and Slemp Elizabeth
Bought by
Bose Allen Steven and Bose Brittany A
Home Financials for this Owner
Home Financials are based on the most recent Mortgage that was taken out on this home.
Original Mortgage
$171,612
Interest Rate
3.7%
Mortgage Type
VA
Purchase Details
Closed on
Dec 9, 2010
Sold by
American Homesmith Llc
Bought by
Slemp William and Slemp Elizabeth
Home Financials for this Owner
Home Financials are based on the most recent Mortgage that was taken out on this home.
Original Mortgage
$168,400
Interest Rate
4.32%
Mortgage Type
VA
Purchase Details
Closed on
Apr 6, 2010
Sold by
Baysden Danny E and Baysden Wanda K
Bought by
American Homesmith Llc
Create a Home Valuation Report for This Property
The Home Valuation Report is an in-depth analysis detailing your home's value as well as a comparison with similar homes in the area
Home Values in the Area
Average Home Value in this Area
Purchase History
| Date | Buyer | Sale Price | Title Company |
|---|---|---|---|
| Bose Allen Steven | -- | None Listed On Document | |
| Bose Allen Steven | $168,000 | None Available | |
| Slemp William | $165,000 | None Available | |
| American Homesmith Llc | $90,000 | None Available |
Source: Public Records
Mortgage History
| Date | Status | Borrower | Loan Amount |
|---|---|---|---|
| Previous Owner | Bose Allen Steven | $171,612 | |
| Previous Owner | Slemp William | $168,400 |
Source: Public Records
Tax History Compared to Growth
Tax History
| Year | Tax Paid | Tax Assessment Tax Assessment Total Assessment is a certain percentage of the fair market value that is determined by local assessors to be the total taxable value of land and additions on the property. | Land | Improvement |
|---|---|---|---|---|
| 2025 | $1,348 | $205,865 | $40,000 | $165,865 |
| 2024 | $1,348 | $205,865 | $40,000 | $165,865 |
| 2023 | $1,348 | $205,865 | $40,000 | $165,865 |
| 2022 | $1,348 | $205,865 | $40,000 | $165,865 |
| 2021 | $1,004 | $142,340 | $25,000 | $117,340 |
| 2020 | $1,004 | $142,340 | $25,000 | $117,340 |
| 2019 | $1,004 | $142,340 | $25,000 | $117,340 |
| 2018 | $1,004 | $142,340 | $25,000 | $117,340 |
| 2017 | $941 | $139,410 | $31,000 | $108,410 |
| 2016 | $941 | $139,410 | $0 | $0 |
| 2015 | $941 | $139,410 | $0 | $0 |
| 2014 | $941 | $139,410 | $0 | $0 |
Source: Public Records
Map
Nearby Homes
- 315 Haywood Dr
- 105 Dole Ct
- 293 Haywood Dr
- 297 Haywood Dr
- 255 Deer Haven Dr
- 100 Dole Ct
- 102 Dole Ct
- 253 Deer Haven Dr
- 404 Silva Cove
- 170 Cavanaughtown Rd
- 418 Wade Dr
- 416 Wade Dr
- 410 Wade Dr
- 400 Wade Dr
- 402 Wade Dr
- 414 Wade Dr
- 412 Wade Dr
- GALEN Plan at Driftwood
- MANNING Plan at Driftwood
- KERRY Plan at Driftwood