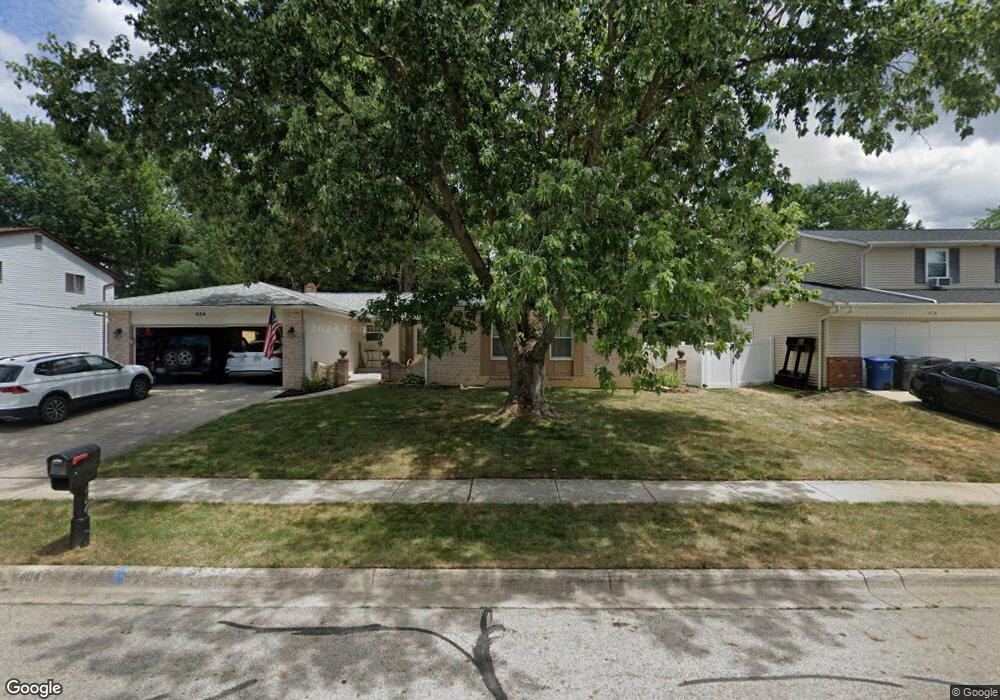
404 Lytton Way Columbus, OH 43230
Gahanna-Havens Corners NeighborhoodEstimated Value: $364,963 - $422,000
3
Beds
2
Baths
1,750
Sq Ft
$227/Sq Ft
Est. Value
About This Home
This home is located at 404 Lytton Way, Columbus, OH 43230 and is currently estimated at $397,741, approximately $227 per square foot. 404 Lytton Way is a home located in Franklin County with nearby schools including Lincoln Elementary School, Gahanna South Middle School, and Lincoln High School.
Ownership History
Date
Name
Owned For
Owner Type
Purchase Details
Closed on
Oct 26, 2007
Sold by
Horch Judith D and Brown Steven L
Bought by
Bedell Steven D and Bedell Angela M
Current Estimated Value
Purchase Details
Closed on
Aug 7, 2007
Sold by
Brown Muriel L and The Muriel L Brown Trust
Bought by
Horch Judith D
Purchase Details
Closed on
Jul 6, 2007
Sold by
Horch Judith D and Horch Phillip
Bought by
Horch Judith D and Brown Steven L
Purchase Details
Closed on
Sep 28, 2005
Sold by
Brown Muriel L
Bought by
Brown Muriel L and Muriel L Brown Trust
Purchase Details
Closed on
Sep 7, 2005
Sold by
Estate Of Donald J Brown
Bought by
Brown Muriel L
Purchase Details
Closed on
Jul 11, 1974
Bought by
Brown Donald J
Create a Home Valuation Report for This Property
The Home Valuation Report is an in-depth analysis detailing your home's value as well as a comparison with similar homes in the area
Home Values in the Area
Average Home Value in this Area
Purchase History
| Date | Buyer | Sale Price | Title Company |
|---|---|---|---|
| Bedell Steven D | -- | Attorney | |
| Horch Judith D | -- | Attorney | |
| Horch Judith D | -- | Attorney | |
| Brown Muriel L | -- | -- | |
| Brown Muriel L | -- | -- | |
| Brown Donald J | -- | -- |
Source: Public Records
Tax History Compared to Growth
Tax History
| Year | Tax Paid | Tax Assessment Tax Assessment Total Assessment is a certain percentage of the fair market value that is determined by local assessors to be the total taxable value of land and additions on the property. | Land | Improvement |
|---|---|---|---|---|
| 2024 | $6,194 | $105,140 | $20,020 | $85,120 |
| 2023 | $6,116 | $105,140 | $20,020 | $85,120 |
| 2022 | $5,238 | $70,140 | $12,950 | $57,190 |
| 2021 | $5,066 | $70,140 | $12,950 | $57,190 |
| 2020 | $5,023 | $70,140 | $12,950 | $57,190 |
| 2019 | $4,203 | $58,560 | $10,780 | $47,780 |
| 2018 | $3,903 | $58,560 | $10,780 | $47,780 |
| 2017 | $3,858 | $58,560 | $10,780 | $47,780 |
| 2016 | $3,631 | $50,200 | $13,970 | $36,230 |
| 2015 | $3,634 | $50,200 | $13,970 | $36,230 |
| 2014 | $3,606 | $50,200 | $13,970 | $36,230 |
| 2013 | $1,767 | $49,525 | $13,300 | $36,225 |
Source: Public Records
Map
Nearby Homes
- 305 Caro Ln
- 555 Chadwood Dr
- 610 Chadwood Dr
- 603 Fawndale Place
- 745 Fleetrun Ave
- 321 Flint Ridge Dr
- 1034 Pinewood Ln Unit 11-4
- 174 Grand Ridge Ct
- 183 Serran Dr
- 219 N Hamilton Rd
- 970 Claycraft Rd
- 5944 Havens Corners Rd
- 6598 Estate View Dr S
- 206 Lintner St
- 875 Taylor Station Rd
- 5986 Stratton Place
- 3165 Souder Dr
- 3005 Souder Dr
- 5938 Stratton Place
- 373 Lyncroft Dr
- 414 Lytton Way
- 396 Lytton Way
- 409 Schyler Way
- 399 Schyler Way
- 390 Lytton Way
- 424 Lytton Way
- 417 Schyler Way
- 415 Lytton Way
- 405 Lytton Way
- 397 Lytton Way
- 425 Schyler Way
- 425 Lytton Way
- 432 Lytton Way
- 391 Lytton Way
- 433 Schyler Way
- 375 Schyler Way
- 381 Lytton Way
- 374 Lytton Way
- 418 Schyler Way
- 437 Lytton Way