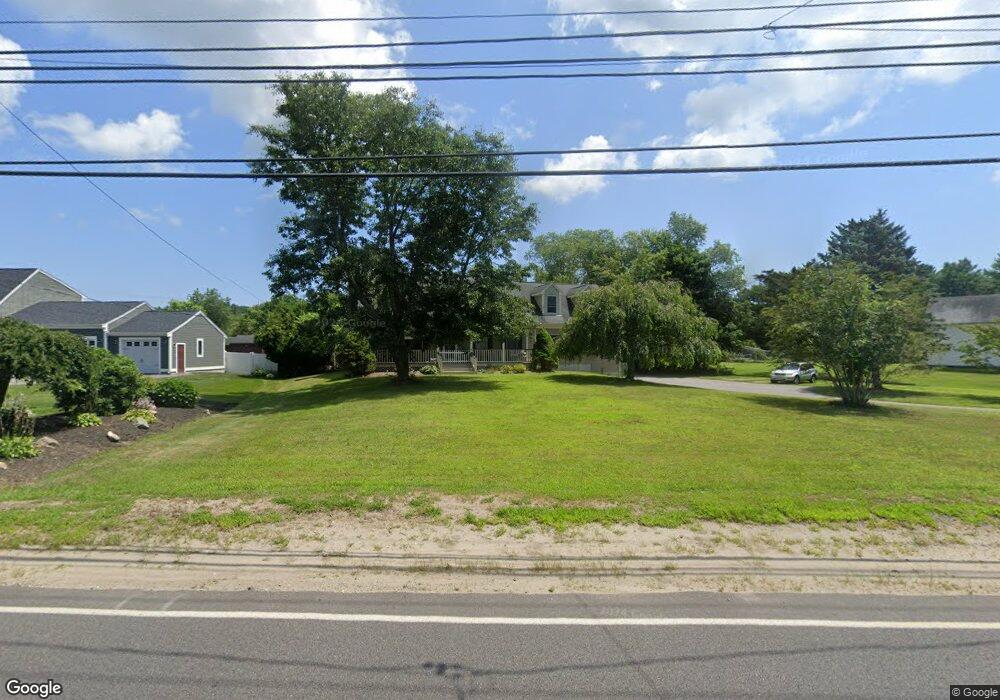
404 Main St Acushnet, MA 02743
Upper Acushnet NeighborhoodEstimated Value: $620,713 - $756,000
4
Beds
2
Baths
2,489
Sq Ft
$274/Sq Ft
Est. Value
About This Home
This home is located at 404 Main St, Acushnet, MA 02743 and is currently estimated at $681,928, approximately $273 per square foot. 404 Main St is a home located in Bristol County with nearby schools including Acushnet Elementary School, Albert F Ford Middle School, and Alma Del Mar Charter School.
Ownership History
Date
Name
Owned For
Owner Type
Purchase Details
Closed on
Feb 11, 1991
Sold by
Deterra Kathleen A and Demello John C
Bought by
Medeiros Chas M and Medeiros Sherri
Current Estimated Value
Create a Home Valuation Report for This Property
The Home Valuation Report is an in-depth analysis detailing your home's value as well as a comparison with similar homes in the area
Home Values in the Area
Average Home Value in this Area
Purchase History
| Date | Buyer | Sale Price | Title Company |
|---|---|---|---|
| Medeiros Chas M | $40,000 | -- |
Source: Public Records
Mortgage History
| Date | Status | Borrower | Loan Amount |
|---|---|---|---|
| Open | Medeiros Chas M | $306,000 | |
| Closed | Medeiros Chas M | $329,600 | |
| Closed | Medeiros Chas M | $10,000 | |
| Closed | Medeiros Chas M | $151,000 |
Source: Public Records
Tax History Compared to Growth
Tax History
| Year | Tax Paid | Tax Assessment Tax Assessment Total Assessment is a certain percentage of the fair market value that is determined by local assessors to be the total taxable value of land and additions on the property. | Land | Improvement |
|---|---|---|---|---|
| 2025 | $60 | $552,700 | $163,300 | $389,400 |
| 2024 | $5,945 | $521,000 | $154,700 | $366,300 |
| 2023 | $6,024 | $502,000 | $140,400 | $361,600 |
| 2022 | $5,977 | $450,400 | $131,800 | $318,600 |
| 2021 | $5,576 | $403,200 | $131,800 | $271,400 |
| 2020 | $5,501 | $394,600 | $123,200 | $271,400 |
| 2019 | $5,281 | $372,400 | $117,500 | $254,900 |
| 2018 | $5,115 | $354,700 | $117,500 | $237,200 |
| 2017 | $4,983 | $345,100 | $117,500 | $227,600 |
| 2016 | $5,096 | $350,700 | $117,500 | $233,200 |
| 2015 | $4,685 | $328,100 | $117,500 | $210,600 |
Source: Public Records
Map
Nearby Homes
- 363 Main St
- 25 Pershing Ave
- 41 Chershire Ave
- 0 Hathaway Rd Unit 73469544
- 329 Middle Rd
- 16 Morses Ln
- 76 Main St
- 14 Hayes St Unit 1
- 12 Hayes St Unit 1
- 134 Nyes Ln
- 0 Confidential Way Unit 73340085
- 65 Armsby St
- 12 Pontiac St
- 303 Cummington St
- 1026 Shelburne St
- 14 Caswell St
- ES Acushnet Ave
- 91 S Main St
- 40 Foley Dr
- 81 Sylvia St