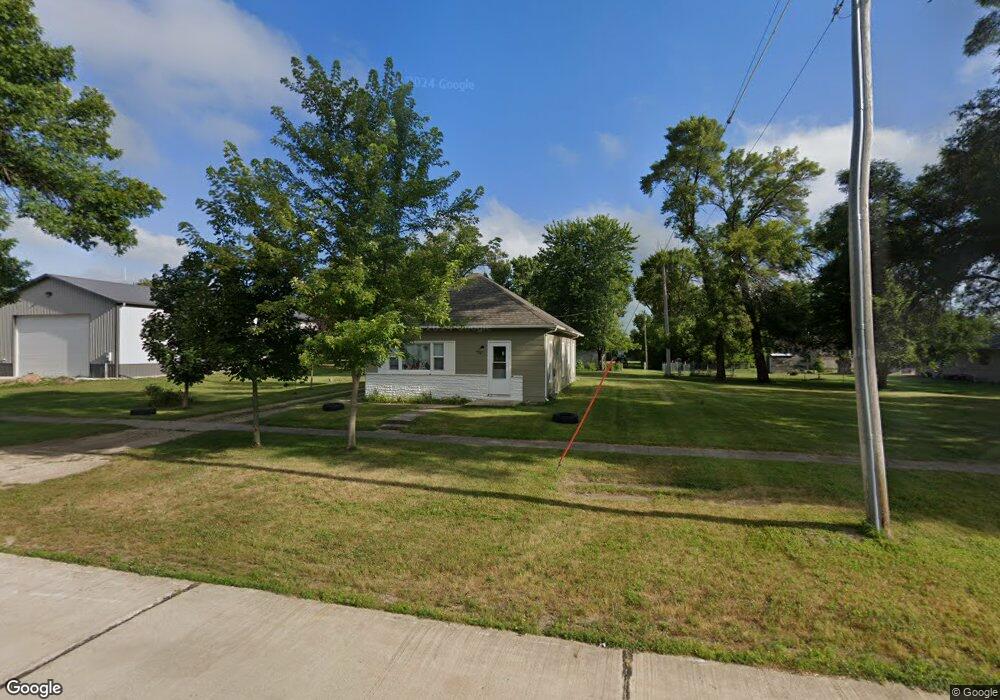
404 Main St Terril, IA 51364
Estimated Value: $65,000 - $183,000
2
Beds
1
Bath
1,056
Sq Ft
$108/Sq Ft
Est. Value
About This Home
This home is located at 404 Main St, Terril, IA 51364 and is currently estimated at $113,541, approximately $107 per square foot. 404 Main St is a home located in Dickinson County with nearby schools including Graettinger-Terril Elementary School, Graettinger-Terril High School, and Graettinger-Terril Middle School.
Ownership History
Date
Name
Owned For
Owner Type
Purchase Details
Closed on
May 7, 2019
Sold by
Fhlm
Bought by
Jensen Investments Llc
Current Estimated Value
Purchase Details
Closed on
Dec 3, 2011
Sold by
Mccarthy William E and Mccarthy Sandra E
Bought by
Eastlick Phillip Merton
Home Financials for this Owner
Home Financials are based on the most recent Mortgage that was taken out on this home.
Original Mortgage
$34,200
Interest Rate
4.11%
Mortgage Type
New Conventional
Create a Home Valuation Report for This Property
The Home Valuation Report is an in-depth analysis detailing your home's value as well as a comparison with similar homes in the area
Home Values in the Area
Average Home Value in this Area
Purchase History
| Date | Buyer | Sale Price | Title Company |
|---|---|---|---|
| Jensen Investments Llc | -- | -- | |
| Eastlick Phillip Merton | $36,000 | None Available |
Source: Public Records
Mortgage History
| Date | Status | Borrower | Loan Amount |
|---|---|---|---|
| Previous Owner | Eastlick Phillip Merton | $34,200 |
Source: Public Records
Tax History
| Year | Tax Paid | Tax Assessment Tax Assessment Total Assessment is a certain percentage of the fair market value that is determined by local assessors to be the total taxable value of land and additions on the property. | Land | Improvement |
|---|---|---|---|---|
| 2025 | $642 | $64,200 | $7,700 | $56,500 |
| 2024 | $642 | $47,600 | $6,300 | $41,300 |
| 2023 | $574 | $47,600 | $6,300 | $41,300 |
| 2022 | $558 | $36,300 | $3,500 | $32,800 |
| 2021 | $558 | $36,300 | $3,500 | $32,800 |
| 2020 | $440 | $30,400 | $3,200 | $27,200 |
| 2019 | $338 | $30,400 | $3,200 | $27,200 |
| 2018 | $336 | $34,600 | $2,700 | $31,900 |
| 2017 | $336 | $34,600 | $2,700 | $31,900 |
| 2016 | $338 | $34,600 | $2,700 | $31,900 |
| 2015 | $326 | $34,600 | $2,700 | $31,900 |
| 2014 | $354 | $36,700 | $3,300 | $33,400 |
| 2013 | -- | $36,700 | $3,300 | $33,400 |
Source: Public Records
Map
Nearby Homes
- 410 E Taylor Ave
- 190th 190th St
- 25990 Woodside Ct
- 1206 Wood Duck Rd
- 24 Ann St
- 00 Ann St
- 25329 182nd St
- 16 Helen Ave
- 20 Helen Ave
- 1103 Sunshine Run
- 25490 182nd St
- 17093 Lakewood Dr
- 0 Blueheron Rd
- 170th Street
- 711 Sunshine Run
- 16933 256th Ave
- 20560 232nd Ave
- 1663 365th Ave
- 1665 365th Ave
- 1661 365th Ave
Your Personal Tour Guide
Ask me questions while you tour the home.