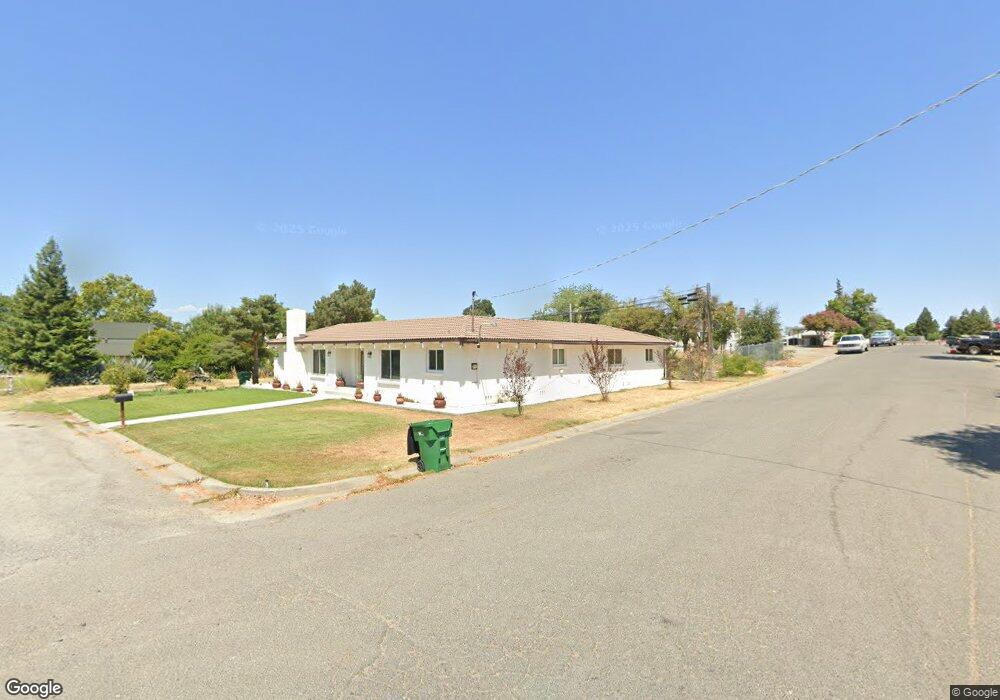
404 Marin St Corning, CA 96021
Estimated Value: $329,316 - $430,000
5
Beds
2
Baths
2,164
Sq Ft
$167/Sq Ft
Est. Value
About This Home
This home is located at 404 Marin St, Corning, CA 96021 and is currently estimated at $362,329, approximately $167 per square foot. 404 Marin St is a home located in Tehama County with nearby schools including Olive View Elementary School, Maywood Middle School, and Corning High School.
Ownership History
Date
Name
Owned For
Owner Type
Purchase Details
Closed on
Feb 1, 2024
Sold by
Acevedo Elia
Bought by
Acevedo Elia and Acevedo Diana
Current Estimated Value
Purchase Details
Closed on
Feb 16, 2001
Sold by
Stewart Lowell T and Stewart Carol A
Bought by
Acevedo Ricardo and Acevedo Elia
Home Financials for this Owner
Home Financials are based on the most recent Mortgage that was taken out on this home.
Original Mortgage
$122,000
Interest Rate
7.72%
Create a Home Valuation Report for This Property
The Home Valuation Report is an in-depth analysis detailing your home's value as well as a comparison with similar homes in the area
Purchase History
We collect this data history from publicly available records. To have your information removed, we recommend requesting removal directly through your county’s website.
| Date | Buyer | Sale Price | Title Company |
|---|---|---|---|
| Acevedo Elia | -- | None Listed On Document | |
| Acevedo Ricardo | $152,500 | Chicago Title Co |
Source: Public Records
Mortgage History
We collect this data history from publicly available records. To have your information removed, we recommend requesting removal directly through your county’s website.
| Date | Status | Borrower | Loan Amount |
|---|---|---|---|
| Previous Owner | Acevedo Ricardo | $122,000 | |
| Closed | Acevedo Ricardo | $30,500 |
Source: Public Records
Tax History
| Year | Tax Paid | Tax Assessment Tax Assessment Total Assessment is a certain percentage of the fair market value that is determined by local assessors to be the total taxable value of land and additions on the property. | Land | Improvement |
|---|---|---|---|---|
| 2025 | $2,122 | $205,677 | $27,119 | $178,558 |
| 2023 | $2,082 | $197,692 | $26,067 | $171,625 |
| 2022 | $2,053 | $193,816 | $25,556 | $168,260 |
| 2021 | $1,976 | $190,016 | $25,055 | $164,961 |
| 2020 | $1,997 | $188,069 | $24,799 | $163,270 |
| 2019 | $1,915 | $184,382 | $24,313 | $160,069 |
| 2018 | $1,918 | $180,768 | $23,837 | $156,931 |
| 2017 | $1,772 | $164,824 | $21,735 | $143,089 |
| 2016 | $1,605 | $156,975 | $20,700 | $136,275 |
| 2015 | $1,621 | $156,975 | $20,700 | $136,275 |
| 2014 | $1,413 | $136,500 | $18,000 | $118,500 |
Source: Public Records
Map
Nearby Homes
Your Personal Tour Guide
Ask me questions while you tour the home.