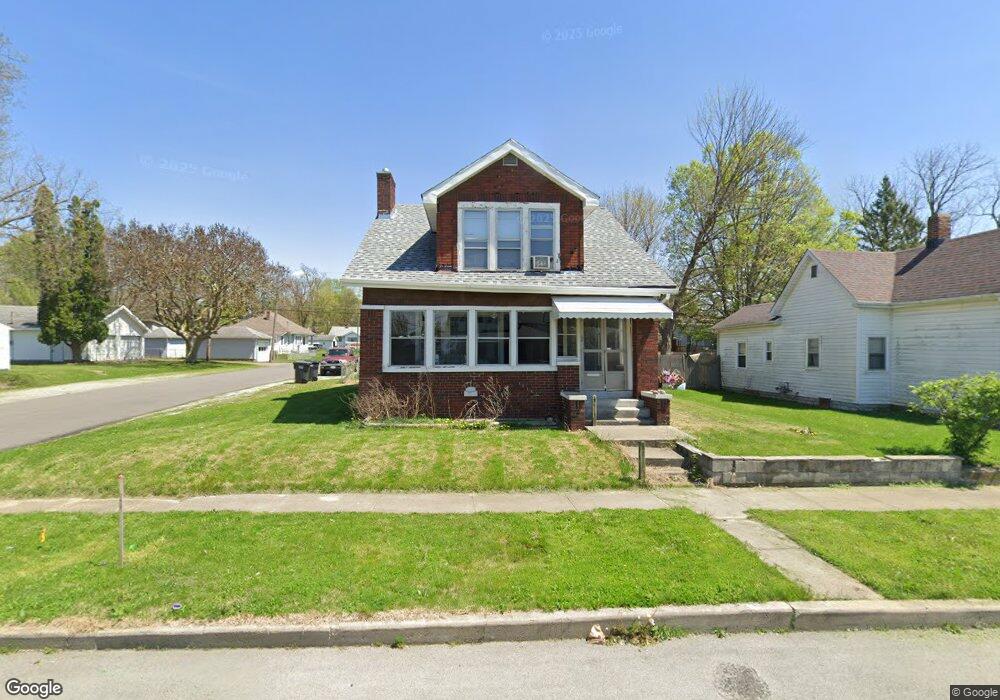
404 Milton Ave Anderson, IN 46012
Estimated Value: $125,000 - $140,001
3
Beds
2
Baths
2,298
Sq Ft
$57/Sq Ft
Est. Value
About This Home
This home is located at 404 Milton Ave, Anderson, IN 46012 and is currently estimated at $131,000, approximately $57 per square foot. 404 Milton Ave is a home located in Madison County with nearby schools including Tenth Street Elementary School, Highland Middle School, and Anderson High School.
Ownership History
Date
Name
Owned For
Owner Type
Purchase Details
Closed on
Oct 7, 2014
Sold by
Graves Gerri Lynn
Bought by
Carr Dwight
Current Estimated Value
Purchase Details
Closed on
Jun 19, 2012
Sold by
Williamson Tai Edward
Bought by
Williamson Gerri Lynn and Graves Gerri Lynn
Purchase Details
Closed on
Mar 30, 2011
Sold by
Household Finance Corp Iii
Bought by
Williamson Tai Edward and Williamson Gerri Lynn
Purchase Details
Closed on
Apr 11, 2010
Sold by
Morales Apolinar Roman
Bought by
Household Finance Corp Iii
Create a Home Valuation Report for This Property
The Home Valuation Report is an in-depth analysis detailing your home's value as well as a comparison with similar homes in the area
Home Values in the Area
Average Home Value in this Area
Purchase History
| Date | Buyer | Sale Price | Title Company |
|---|---|---|---|
| Carr Dwight | -- | -- | |
| Williamson Gerri Lynn | -- | None Available | |
| Williamson Tai Edward | -- | None Available | |
| Household Finance Corp Iii | -- | None Available |
Source: Public Records
Tax History Compared to Growth
Tax History
| Year | Tax Paid | Tax Assessment Tax Assessment Total Assessment is a certain percentage of the fair market value that is determined by local assessors to be the total taxable value of land and additions on the property. | Land | Improvement |
|---|---|---|---|---|
| 2025 | $1,960 | $88,200 | $6,400 | $81,800 |
| 2024 | $1,960 | $88,200 | $6,400 | $81,800 |
| 2023 | $1,796 | $80,300 | $6,100 | $74,200 |
| 2022 | $1,790 | $80,000 | $5,800 | $74,200 |
| 2021 | $1,647 | $73,200 | $5,700 | $67,500 |
| 2020 | $1,584 | $70,100 | $5,500 | $64,600 |
| 2019 | $1,540 | $68,100 | $5,500 | $62,600 |
| 2018 | $1,493 | $64,700 | $5,500 | $59,200 |
| 2017 | $1,278 | $63,900 | $5,500 | $58,400 |
| 2016 | $1,294 | $64,700 | $5,600 | $59,100 |
| 2014 | $1,338 | $66,900 | $5,900 | $61,000 |
| 2013 | $1,338 | $66,900 | $5,900 | $61,000 |
Source: Public Records
Map
Nearby Homes
- 414 Milton Ave
- 418 Milton Ave
- 328 Milton Ave
- 328 Milton Ave Unit 2
- 328 Milton Ave Unit 1
- 420 Milton Ave
- 403 Ruddle Ave
- 424 Milton Ave
- 409 Ruddle Ave
- 426 Milton Ave
- 324 Milton Ave
- 315 Ruddle Ave
- 411 Ruddle Ave
- 407 Milton Ave
- 415 Ruddle Ave
- 325 Milton Ave
- 417 Milton Ave
- 428 Milton Ave
- 311 Ruddle Ave
- 421 Milton Ave