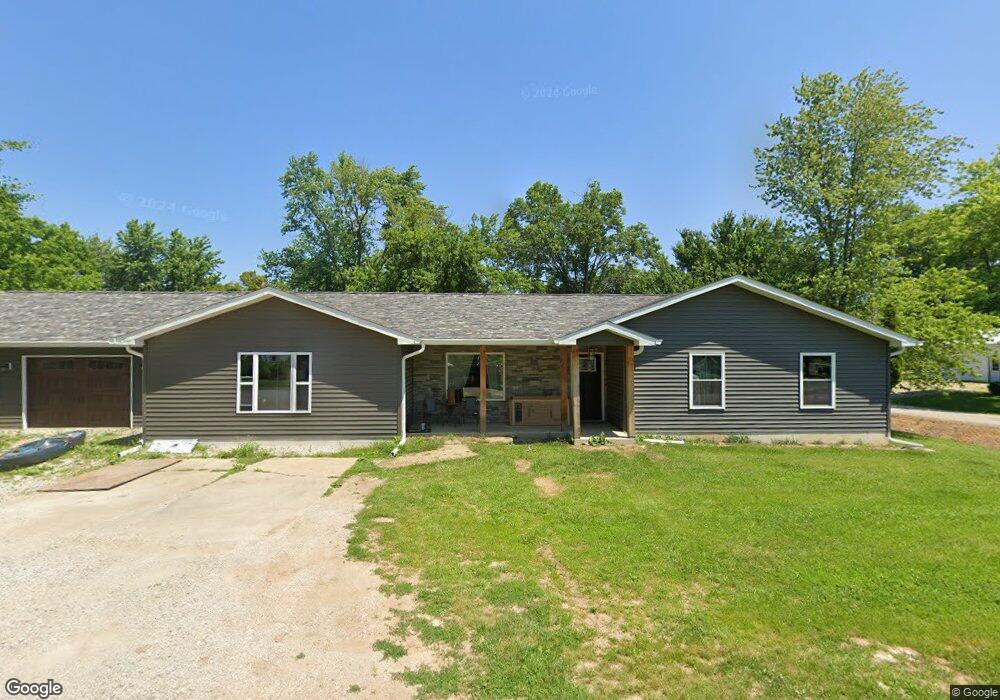
404 Monroe St Nokomis, IL 62075
Estimated Value: $69,000
3
Beds
2
Baths
1,400
Sq Ft
$49/Sq Ft
Est. Value
About This Home
This home is located at 404 Monroe St, Nokomis, IL 62075 and is currently priced at $69,000, approximately $49 per square foot. 404 Monroe St is a home located in Montgomery County with nearby schools including North Elementary School, Nokomis Junior/Senior High School, and St. Louis Catholic School.
Ownership History
Date
Name
Owned For
Owner Type
Purchase Details
Closed on
Jun 28, 2021
Sold by
Spencer Caitlin
Bought by
Spencer Michael and Spencer Caitlin
Current Estimated Value
Home Financials for this Owner
Home Financials are based on the most recent Mortgage that was taken out on this home.
Original Mortgage
$136,000
Outstanding Balance
$125,770
Interest Rate
4.25%
Mortgage Type
New Conventional
Purchase Details
Closed on
Aug 13, 2012
Sold by
Miles Richard B and Miles Betty J
Bought by
Sommer Caitlin Leigh
Home Financials for this Owner
Home Financials are based on the most recent Mortgage that was taken out on this home.
Original Mortgage
$72,512
Interest Rate
3.65%
Mortgage Type
FHA
Create a Home Valuation Report for This Property
The Home Valuation Report is an in-depth analysis detailing your home's value as well as a comparison with similar homes in the area
Purchase History
| Date | Buyer | Sale Price | Title Company |
|---|---|---|---|
| Spencer Michael | -- | Community Title | |
| Sommer Caitlin Leigh | $74,000 | None Available |
Source: Public Records
Mortgage History
| Date | Status | Borrower | Loan Amount |
|---|---|---|---|
| Open | Spencer Michael | $136,000 | |
| Closed | Sommer Caitlin Leigh | $72,512 |
Source: Public Records
Tax History
| Year | Tax Paid | Tax Assessment Tax Assessment Total Assessment is a certain percentage of the fair market value that is determined by local assessors to be the total taxable value of land and additions on the property. | Land | Improvement |
|---|---|---|---|---|
| 2022 | $1,481 | $22,500 | $1,740 | $20,760 |
| 2021 | $1,548 | $23,510 | $1,820 | $21,690 |
| 2020 | $1,463 | $22,430 | $1,740 | $20,690 |
| 2019 | $1,564 | $23,690 | $1,840 | $21,850 |
| 2018 | $1,488 | $22,300 | $1,730 | $20,570 |
| 2017 | $1,410 | $20,970 | $1,630 | $19,340 |
| 2016 | $1,404 | $20,400 | $1,590 | $18,810 |
| 2015 | $1,370 | $19,760 | $1,540 | $18,220 |
| 2013 | $1,322 | $20,010 | $1,560 | $18,450 |
Source: Public Records
Map
Nearby Homes
- 507 N Spruce St
- 318 N Cedar St
- 304 N Spruce St
- 223 N Pine St
- 101 W South St
- 115 W South St
- 405 Griffin St
- 600 Sanford Ave
- 416 Griffin St
- 625 School St
- 900 E Union St
- 185 Montgomery St
- 245 S 7th St
- Three Miles South of Nokomis
- 843 Monroe St
- 504 N Stuart St
- 210 E Raymon Ave
- 529 N 2nd St
- 638 E Ford Ave
- 223 W Broadway
Your Personal Tour Guide
Ask me questions while you tour the home.