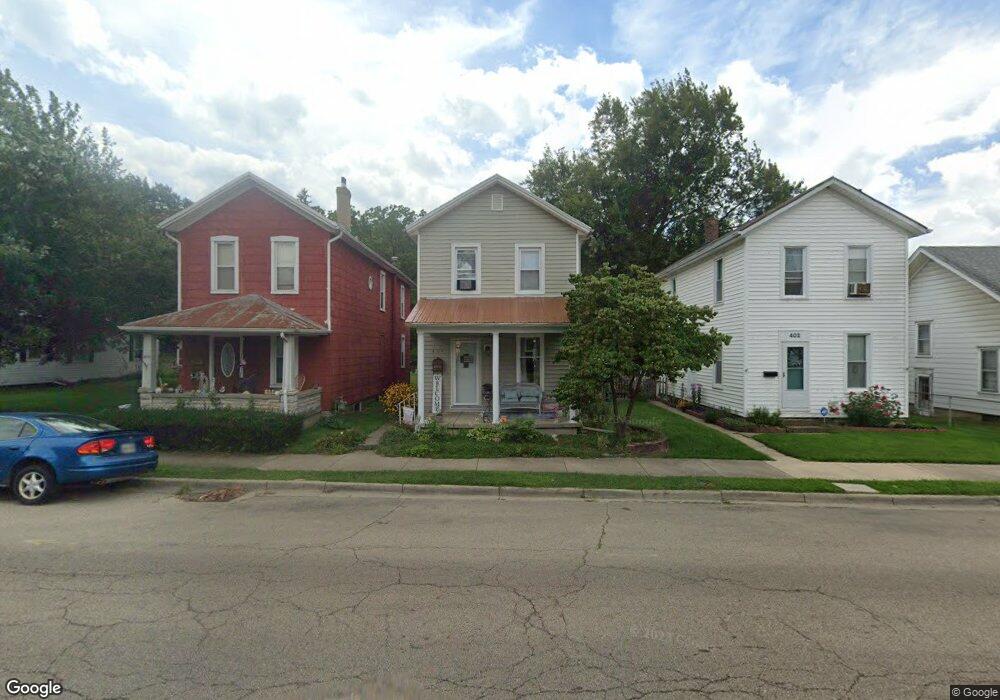
404 Mound Ave Miamisburg, OH 45342
Downtown Miamisburg NeighborhoodEstimated Value: $138,000 - $155,000
2
Beds
1
Bath
1,156
Sq Ft
$127/Sq Ft
Est. Value
About This Home
This home is located at 404 Mound Ave, Miamisburg, OH 45342 and is currently estimated at $146,793, approximately $126 per square foot. 404 Mound Ave is a home located in Montgomery County with nearby schools including Miamisburg High School and Bethel Baptist School.
Ownership History
Date
Name
Owned For
Owner Type
Purchase Details
Closed on
Sep 15, 2025
Sold by
Cvg Home Buyers Llc
Bought by
Athena And Brownie Enterprises Llc
Current Estimated Value
Home Financials for this Owner
Home Financials are based on the most recent Mortgage that was taken out on this home.
Original Mortgage
$100,000
Outstanding Balance
$100,000
Interest Rate
1%
Mortgage Type
New Conventional
Estimated Equity
$46,793
Purchase Details
Closed on
Aug 6, 2025
Sold by
Barnhart Brian and Barnhart Ashleigh
Bought by
Cvg Home Buyers Llc
Home Financials for this Owner
Home Financials are based on the most recent Mortgage that was taken out on this home.
Original Mortgage
$100,000
Outstanding Balance
$100,000
Interest Rate
1%
Mortgage Type
New Conventional
Estimated Equity
$46,793
Purchase Details
Closed on
Sep 5, 1996
Sold by
Wampler Karen M and Pfeiffer Karen M
Bought by
Mcgriff Glenn and Ratliff Linda
Create a Home Valuation Report for This Property
The Home Valuation Report is an in-depth analysis detailing your home's value as well as a comparison with similar homes in the area
Home Values in the Area
Average Home Value in this Area
Purchase History
| Date | Buyer | Sale Price | Title Company |
|---|---|---|---|
| Athena And Brownie Enterprises Llc | $91,000 | Cleveland Home Title | |
| Cvg Home Buyers Llc | $70,000 | Cleveland Home Title | |
| Mcgriff Glenn | $60,000 | -- |
Source: Public Records
Mortgage History
| Date | Status | Borrower | Loan Amount |
|---|---|---|---|
| Open | Athena And Brownie Enterprises Llc | $100,000 | |
| Previous Owner | Cvg Home Buyers Llc | $117,200 |
Source: Public Records
Tax History Compared to Growth
Tax History
| Year | Tax Paid | Tax Assessment Tax Assessment Total Assessment is a certain percentage of the fair market value that is determined by local assessors to be the total taxable value of land and additions on the property. | Land | Improvement |
|---|---|---|---|---|
| 2024 | $2,423 | $38,000 | $4,830 | $33,170 |
| 2023 | $2,423 | $38,000 | $4,830 | $33,170 |
| 2022 | $2,001 | $26,400 | $3,360 | $23,040 |
| 2021 | $1,771 | $26,400 | $3,360 | $23,040 |
| 2020 | $1,767 | $26,400 | $3,360 | $23,040 |
| 2019 | $1,619 | $22,170 | $3,360 | $18,810 |
| 2018 | $1,624 | $22,170 | $3,360 | $18,810 |
| 2017 | $1,613 | $22,170 | $3,360 | $18,810 |
| 2016 | $1,648 | $21,780 | $3,360 | $18,420 |
| 2015 | $973 | $21,780 | $3,360 | $18,420 |
| 2014 | $973 | $21,780 | $3,360 | $18,420 |
| 2012 | -- | $22,590 | $5,100 | $17,490 |
Source: Public Records
Map
Nearby Homes
- 513 Mound Ave
- 619 Jefferson St
- 235 S 7th St
- 150 S Main St
- 111 Old Main St
- 460 S 8th St
- 111 S Main St
- 42 S Main St
- 805 E Linden Ave
- 736 Park Ave
- 607 E Central Ave
- 24 S 8th St
- 740 E Central Ave
- 832 E Maple Ave
- 7 N Riverview Ave
- 265 S Riverview Ave
- 555 E Sycamore St
- 816 E Pearl St
- 319 N 1st St
- 1331 Cherry Hill Dr