
Seller's Agent in 2024
Roger Roemer
Gallery Homes Real Estate
(309) 208-8237
1 in this area
150 Total Sales
Estimated Value: $239,360 - $288,000
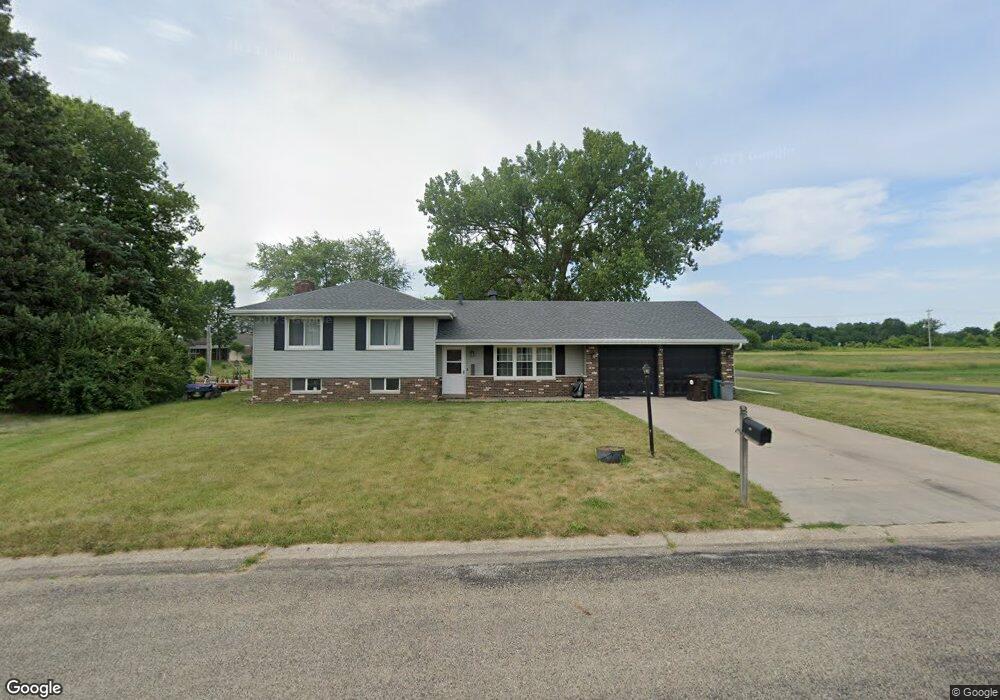
Situated on beautiful lakefront double lot (101 x 144 x 142 x 165), this spacious home offers a blend of comfort and modern updates. Enjoy the open floor plan with fresh paint and new LVP flooring and updated kitchen. The updated windows and newer roof provide both style and efficiency. The main level features a cozy wood-burning round fireplace, perfect for relaxing evenings. The generous master bedroom boasts double closets, while the fully remodeled full bathroom adds a touch of luxury. The lower level is ideal for gatherings, with a large family room that includes walkout french doors leading directly to the lake. An extra-deep attached garage with brand-new garage doors, built-in storage, and a workbench area enhances functionality and convenience. Experience lakefront living at its finest in this wonderful home.
| Date | Buyer | Sale Price | Title Company |
|---|---|---|---|
| Cross Lucas | $250,000 | None Listed On Document |
| Date | Status | Borrower | Loan Amount |
|---|---|---|---|
| Open | Cross Lucas | $225,000 |
| Date | Event | Price | List to Sale | Price per Sq Ft | Prior Sale |
|---|---|---|---|---|---|
| 09/18/2024 09/18/24 | Sold | $250,000 | +0.4% | $106 / Sq Ft | View Prior Sale |
| 08/16/2024 08/16/24 | For Sale | $249,000 | +85.8% | $105 / Sq Ft | |
| 05/17/2017 05/17/17 | Sold | $134,000 | -0.7% | $66 / Sq Ft | View Prior Sale |
| 04/16/2017 04/16/17 | Pending | -- | -- | -- | |
| 04/16/2017 04/16/17 | For Sale | $134,900 | -- | $67 / Sq Ft |
| Year | Tax Paid | Tax Assessment Tax Assessment Total Assessment is a certain percentage of the fair market value that is determined by local assessors to be the total taxable value of land and additions on the property. | Land | Improvement |
|---|---|---|---|---|
| 2024 | $4,173 | $52,870 | $17,880 | $34,990 |
| 2023 | $3,437 | $48,960 | $16,560 | $32,400 |
| 2022 | $3,199 | $45,950 | $15,340 | $30,610 |
| 2021 | $3,052 | $44,180 | $14,750 | $29,430 |
| 2020 | $2,867 | $43,310 | $14,460 | $28,850 |
| 2019 | $2,831 | $43,310 | $14,460 | $28,850 |
| 2018 | $2,805 | $43,310 | $14,460 | $28,850 |
| 2017 | $3,862 | $54,500 | $14,600 | $39,900 |
| 2016 | $3,668 | $55,050 | $14,750 | $40,300 |
| 2015 | $2,881 | $53,970 | $14,460 | $39,510 |
| 2014 | $3,014 | $53,050 | $14,220 | $38,830 |
| 2013 | -- | $53,050 | $14,220 | $38,830 |
Seller's Agent in 2024
Roger Roemer
Gallery Homes Real Estate
(309) 208-8237
1 in this area
150 Total Sales
Buyer's Agent in 2024
Josh Graham
RE/MAX
(309) 258-0543
7 in this area
520 Total Sales
Seller's Agent in 2017
Tamara Krupps
RE/MAX
(309) 370-1158
4 in this area
116 Total Sales