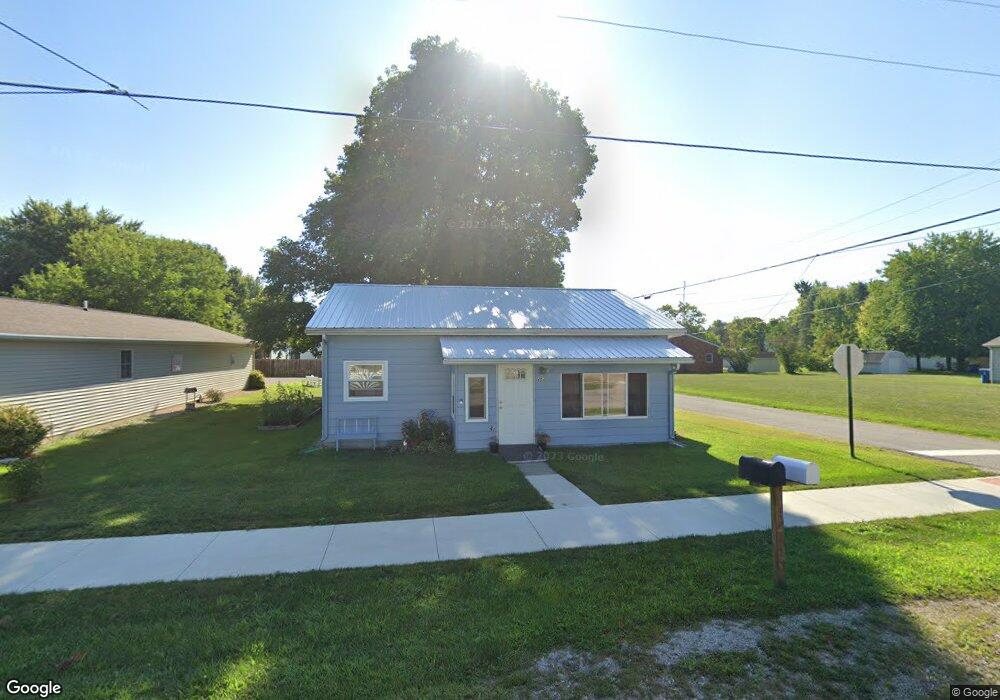
404 N Oak St Edgerton, OH 43517
Estimated Value: $21,437 - $130,000
2
Beds
1
Bath
983
Sq Ft
$91/Sq Ft
Est. Value
About This Home
This home is located at 404 N Oak St, Edgerton, OH 43517 and is currently estimated at $89,109, approximately $90 per square foot. 404 N Oak St is a home located in Williams County with nearby schools including Edgerton Elementary School, Edgerton High School, and St. Mary School.
Ownership History
Date
Name
Owned For
Owner Type
Purchase Details
Closed on
Apr 9, 2019
Sold by
Williams County Land Reutilization Corp
Bought by
Snyder Frederick John and Snyder Patti K
Current Estimated Value
Purchase Details
Closed on
Nov 30, 2018
Sold by
Fifth Third Bank
Bought by
Williams County Land Reutilization Corpo
Purchase Details
Closed on
Apr 7, 2017
Sold by
Laney April and Laney April R
Bought by
Fifth Third Bank
Purchase Details
Closed on
Apr 3, 2006
Sold by
Brown James and Brown Kerri
Bought by
Laney April
Purchase Details
Closed on
Sep 14, 2004
Sold by
Laney April R
Bought by
Laney Brown James and Laney Kerri
Purchase Details
Closed on
Dec 16, 2003
Sold by
Sanders Kathleen A
Bought by
Laney April R
Purchase Details
Closed on
Oct 30, 2002
Sold by
Wonderly Chad M
Bought by
Sanders Kathleen A
Purchase Details
Closed on
Oct 22, 1999
Sold by
Thomas Lois
Bought by
Wonderly Chad M
Purchase Details
Closed on
Jan 1, 1990
Bought by
Thomas Lois
Create a Home Valuation Report for This Property
The Home Valuation Report is an in-depth analysis detailing your home's value as well as a comparison with similar homes in the area
Home Values in the Area
Average Home Value in this Area
Purchase History
| Date | Buyer | Sale Price | Title Company |
|---|---|---|---|
| Snyder Frederick John | $12,400 | None Available | |
| Williams County Land Reutilization Corpo | -- | None Available | |
| Fifth Third Bank | -- | None Available | |
| Laney April | -- | None Available | |
| Laney Brown James | $50,500 | -- | |
| Laney April R | $50,000 | -- | |
| Sanders Kathleen A | $39,000 | -- | |
| Wonderly Chad M | $37,500 | -- | |
| Thomas Lois | -- | -- |
Source: Public Records
Tax History Compared to Growth
Tax History
| Year | Tax Paid | Tax Assessment Tax Assessment Total Assessment is a certain percentage of the fair market value that is determined by local assessors to be the total taxable value of land and additions on the property. | Land | Improvement |
|---|---|---|---|---|
| 2024 | $393 | $19,290 | $2,730 | $16,560 |
| 2023 | $764 | $15,400 | $2,800 | $12,600 |
| 2022 | $680 | $15,400 | $2,800 | $12,600 |
| 2021 | $680 | $15,400 | $2,800 | $12,600 |
| 2020 | $548 | $11,940 | $2,350 | $9,590 |
| 2019 | $543 | $11,940 | $2,350 | $9,590 |
| 2018 | $226 | $11,940 | $2,350 | $9,590 |
| 2017 | $571 | $10,720 | $2,350 | $8,370 |
| 2016 | $522 | $10,720 | $2,350 | $8,370 |
| 2015 | $478 | $10,720 | $2,350 | $8,370 |
| 2014 | $478 | $10,720 | $2,350 | $8,370 |
| 2013 | $469 | $10,720 | $2,350 | $8,370 |
Source: Public Records
Map
Nearby Homes
- 104 Knox Ln
- 00 County Road 4-50
- 4831 County Road 4-50
- 1974 State Route 49
- 6163 County Road 4-50
- 8873 County Road C
- 3631 Lake St
- 0 County Road G
- 7825 County Road 7g
- 10258 County Road D Unit A
- 202 N Ivy Ln
- 615 E Main St
- 324 N Park Ln
- 000 S Ivy Ln
- 618 E Main St
- 0 E Green St Unit 202539588
- 510 E Green St
- 416 E Green St
- 322 Dublin Ln
- 324 Dublin Ln