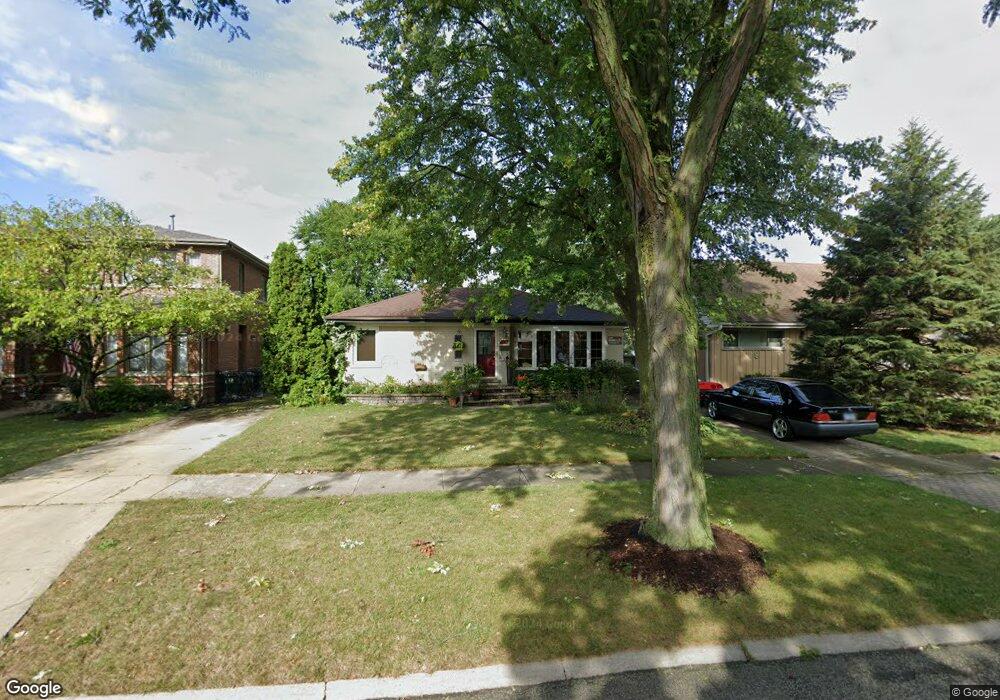
404 N Redfield Ct Park Ridge, IL 60068
Estimated Value: $379,000 - $457,000
2
Beds
1
Bath
960
Sq Ft
$443/Sq Ft
Est. Value
About This Home
This home is located at 404 N Redfield Ct, Park Ridge, IL 60068 and is currently estimated at $425,070, approximately $442 per square foot. 404 N Redfield Ct is a home located in Cook County with nearby schools including George B Carpenter Elementary School, Lincoln Middle School, and Maine South High School.
Ownership History
Date
Name
Owned For
Owner Type
Purchase Details
Closed on
Apr 21, 2014
Sold by
Barcelona Josephine L and Barcelona Rolando L
Bought by
Barcelona Rolando L and Barcelona Josephine L
Current Estimated Value
Home Financials for this Owner
Home Financials are based on the most recent Mortgage that was taken out on this home.
Original Mortgage
$525,000
Outstanding Balance
$409,639
Interest Rate
5.06%
Mortgage Type
Reverse Mortgage Home Equity Conversion Mortgage
Estimated Equity
$15,431
Purchase Details
Closed on
Mar 17, 1997
Sold by
Mckenna Michael P and Mckenna Kelley J
Bought by
Barcelona Ronald L and Salazar Josephine L
Home Financials for this Owner
Home Financials are based on the most recent Mortgage that was taken out on this home.
Original Mortgage
$154,000
Interest Rate
7.82%
Create a Home Valuation Report for This Property
The Home Valuation Report is an in-depth analysis detailing your home's value as well as a comparison with similar homes in the area
Home Values in the Area
Average Home Value in this Area
Purchase History
| Date | Buyer | Sale Price | Title Company |
|---|---|---|---|
| Barcelona Rolando L | -- | None Available | |
| Barcelona Ronald L | $192,000 | -- |
Source: Public Records
Mortgage History
| Date | Status | Borrower | Loan Amount |
|---|---|---|---|
| Open | Barcelona Rolando L | $525,000 | |
| Closed | Barcelona Ronald L | $154,000 |
Source: Public Records
Tax History Compared to Growth
Tax History
| Year | Tax Paid | Tax Assessment Tax Assessment Total Assessment is a certain percentage of the fair market value that is determined by local assessors to be the total taxable value of land and additions on the property. | Land | Improvement |
|---|---|---|---|---|
| 2024 | $7,880 | $35,000 | $8,580 | $26,420 |
| 2023 | $7,501 | $35,000 | $8,580 | $26,420 |
| 2022 | $7,501 | $35,000 | $8,580 | $26,420 |
| 2021 | $7,364 | $30,207 | $5,610 | $24,597 |
| 2020 | $7,192 | $30,207 | $5,610 | $24,597 |
| 2019 | $7,139 | $33,564 | $5,610 | $27,954 |
| 2018 | $5,751 | $26,279 | $4,950 | $21,329 |
| 2017 | $5,757 | $26,279 | $4,950 | $21,329 |
| 2016 | $6,036 | $26,279 | $4,950 | $21,329 |
| 2015 | $6,242 | $22,863 | $4,290 | $18,573 |
| 2014 | $6,136 | $22,863 | $4,290 | $18,573 |
| 2013 | $5,795 | $22,863 | $4,290 | $18,573 |
Source: Public Records
Map
Nearby Homes
- 2121 W Sibley St
- 300 Boardwalk Place Unit T300
- 601 N Broadway Ave
- 408 N Seminary Ave
- 44 Park Ln Unit 223
- 44 Park Ln Unit 435
- 22 Park Ln Unit 203
- 20 S Dee Rd
- 60 S Dee Rd Unit G
- 819 Busse Hwy
- 716 N Western Ave
- 832 Sylviawood Ave
- 911 Busse Hwy Unit 302
- 200 Thames Pkwy Unit 1
- 776 N Northwest Hwy
- 2200 Bouterse St Unit 409B
- 2200 Bouterse St Unit 407
- 722 N Northwest Hwy Unit A
- 751 N Northwest Hwy
- 901 Florence Dr
- 400 N Redfield Ct
- 408 N Redfield Ct
- 320 N Redfield Ct
- 412 N Redfield Ct
- 409 N Dee Rd
- 411 N Dee Rd
- 411 N Dee Rd
- 403 N Dee Rd
- 316 N Redfield Ct
- 416 N Redfield Ct
- 321 N Dee Rd
- 417 N Dee Rd
- 405 N Redfield Ct
- 420 N Redfield Ct
- 312 N Redfield Ct
- 401 N Redfield Ct
- 409 N Redfield Ct
- 321 N Redfield Ct
- 413 N Redfield Ct
- 421 N Dee Rd