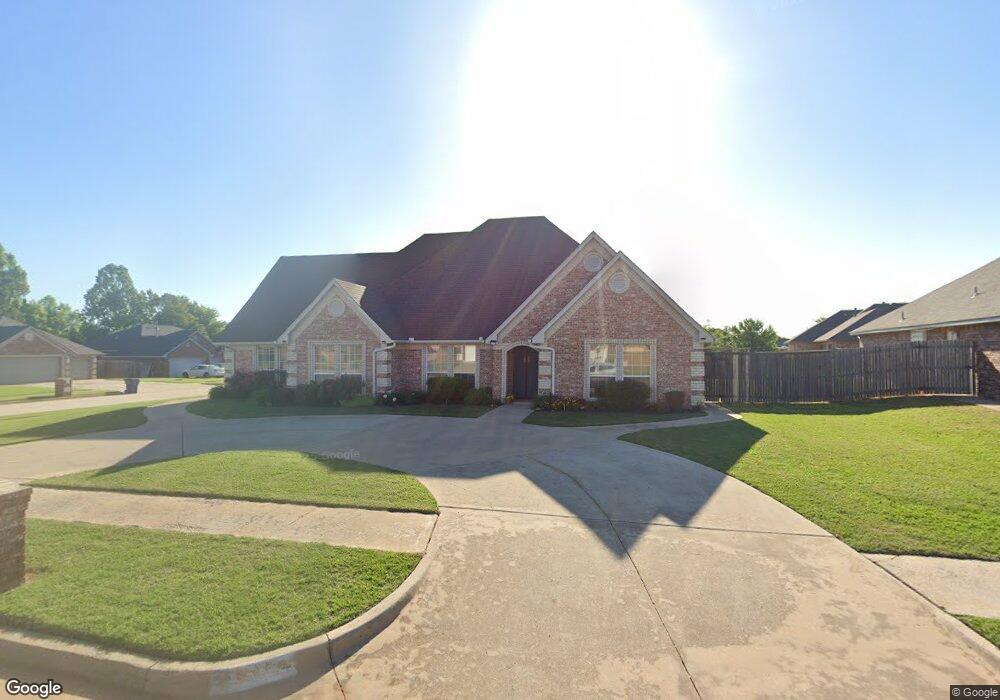
404 N Topaz Way Mustang, OK 73064
Estimated Value: $353,000 - $384,422
5
Beds
3
Baths
3,020
Sq Ft
$122/Sq Ft
Est. Value
About This Home
This home is located at 404 N Topaz Way, Mustang, OK 73064 and is currently estimated at $368,606, approximately $122 per square foot. 404 N Topaz Way is a home located in Canadian County with nearby schools including Mustang Lakehoma Elementary School, Mustang Horizon Intermediate School, and Mustang Middle School.
Ownership History
Date
Name
Owned For
Owner Type
Purchase Details
Closed on
Nov 21, 2011
Sold by
Williams Osajyefo and Williams Kymiyo
Current Estimated Value
Purchase Details
Closed on
Nov 24, 2004
Sold by
Rexroad Steven N
Home Financials for this Owner
Home Financials are based on the most recent Mortgage that was taken out on this home.
Original Mortgage
$163,200
Interest Rate
5.68%
Purchase Details
Closed on
Jan 28, 2002
Sold by
Berkley Kirk A
Purchase Details
Closed on
Feb 1, 2001
Sold by
Teddy Jason
Purchase Details
Closed on
Dec 18, 2000
Sold by
Berkley,Alan D Trustee
Create a Home Valuation Report for This Property
The Home Valuation Report is an in-depth analysis detailing your home's value as well as a comparison with similar homes in the area
Home Values in the Area
Average Home Value in this Area
Purchase History
| Date | Buyer | Sale Price | Title Company |
|---|---|---|---|
| -- | -- | -- | |
| -- | $204,000 | -- | |
| -- | $200,000 | -- | |
| -- | -- | -- | |
| -- | $20,500 | -- | |
| -- | -- | -- |
Source: Public Records
Mortgage History
| Date | Status | Borrower | Loan Amount |
|---|---|---|---|
| Previous Owner | -- | $163,200 |
Source: Public Records
Tax History Compared to Growth
Tax History
| Year | Tax Paid | Tax Assessment Tax Assessment Total Assessment is a certain percentage of the fair market value that is determined by local assessors to be the total taxable value of land and additions on the property. | Land | Improvement |
|---|---|---|---|---|
| 2024 | $2,860 | $30,556 | $2,625 | $27,931 |
| 2023 | $2,860 | $29,666 | $2,400 | $27,266 |
| 2022 | $2,807 | $28,802 | $2,400 | $26,402 |
| 2021 | $2,852 | $29,135 | $2,400 | $26,735 |
| 2020 | $2,854 | $28,981 | $2,400 | $26,581 |
| 2019 | $2,768 | $28,137 | $2,400 | $25,737 |
| 2018 | $2,801 | $27,878 | $2,400 | $25,478 |
| 2017 | $2,706 | $27,264 | $2,400 | $24,864 |
| 2016 | $2,794 | $27,486 | $2,400 | $25,086 |
| 2015 | $2,819 | $25,773 | $2,400 | $23,373 |
| 2014 | $2,819 | $27,143 | $2,460 | $24,683 |
Source: Public Records
Map
Nearby Homes
- 401 N Topaz Way
- 313 N Shannon Way
- 320 N Jasper Way
- 101 N Shannon Way
- 913 N Centennial Way
- 1316 W Harvard Way
- 1308 W Harvard Way
- 1401 W Harvard Way
- 1425 W Harvard Way
- 608 N White Tail Way
- 612 N White Tail Way
- 4408 Moonlight Rd
- 4213 Moonlight Rd
- 617 N White Tail Way
- 4716 Bermuda Dr
- 4601 Mustang Park Blvd
- 4712 Bermuda Dr
- 708 N Buckhorn Way
- 520 S Owen Dr
- 1933 W Antler Way
- 400 N Topaz Way
- 401 N Amethyst Way
- 313 N Amethyst Way
- 1425 W Agate Way
- 1429 W Agate Way
- 405 N Topaz Way
- 312 N Topaz Way
- 1421 W Agate Way
- 1433 W Agate Way
- 309 N Amethyst Way
- 1437 W Agate Way
- 1417 W Agate Way
- 313 N Topaz Way
- 308 N Topaz Way
- 1440 W Agate Way
- 316 N Amethyst Way
- 1351 W Agate Way
- 1408 W Whippoorwill Way
- 1416 W Whippoorwill Way
- 305 N Amethyst Way