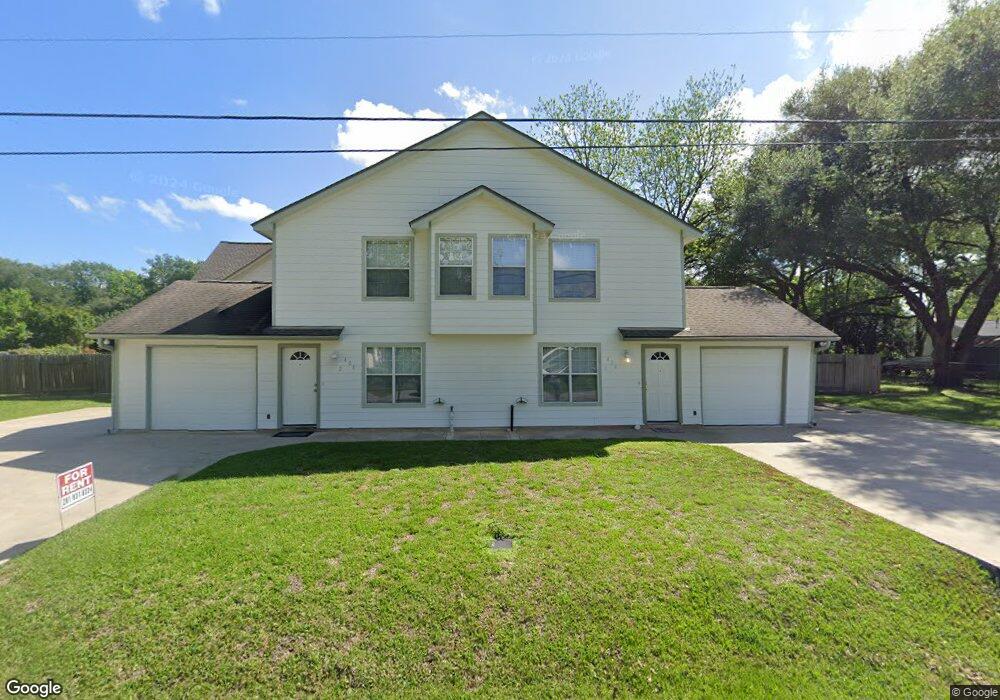
404 Peach St Unit 2 Tomball, TX 77375
Estimated Value: $342,000 - $369,354
2
Beds
3
Baths
1,100
Sq Ft
$326/Sq Ft
Est. Value
About This Home
This home is located at 404 Peach St Unit 2, Tomball, TX 77375 and is currently estimated at $358,118, approximately $325 per square foot. 404 Peach St Unit 2 is a home located in Harris County with nearby schools including Tomball Elementary School, Tomball Intermediate School, and Tomball Junior High School.
Ownership History
Date
Name
Owned For
Owner Type
Purchase Details
Closed on
Aug 22, 2018
Sold by
Graham Rock E and Graham Crystal L
Bought by
Cl Graham Family Investments Llc
Current Estimated Value
Purchase Details
Closed on
Nov 4, 2003
Sold by
Gramax Inc
Bought by
Graham Rock E and Graham Crystal L
Purchase Details
Closed on
Apr 24, 1997
Sold by
Doerre Larry Wayne
Bought by
Gramax Inc
Create a Home Valuation Report for This Property
The Home Valuation Report is an in-depth analysis detailing your home's value as well as a comparison with similar homes in the area
Home Values in the Area
Average Home Value in this Area
Purchase History
| Date | Buyer | Sale Price | Title Company |
|---|---|---|---|
| Cl Graham Family Investments Llc | -- | Accommodation | |
| Graham Rock E | -- | Alamo Title Company | |
| Gramax Inc | -- | Alamo Title Company |
Source: Public Records
Tax History
| Year | Tax Paid | Tax Assessment Tax Assessment Total Assessment is a certain percentage of the fair market value that is determined by local assessors to be the total taxable value of land and additions on the property. | Land | Improvement |
|---|---|---|---|---|
| 2025 | $7,968 | $382,526 | $105,000 | $277,526 |
| 2024 | $7,968 | $418,800 | $98,000 | $320,800 |
| 2023 | $7,968 | $408,900 | $84,000 | $324,900 |
| 2022 | $4,470 | $198,300 | $63,000 | $135,300 |
| 2021 | $4,421 | $186,424 | $45,500 | $140,924 |
| 2020 | $4,165 | $169,800 | $35,000 | $134,800 |
| 2019 | $4,063 | $161,070 | $28,000 | $133,070 |
| 2018 | $2,056 | $153,400 | $28,000 | $125,400 |
| 2017 | $3,866 | $153,400 | $28,000 | $125,400 |
| 2016 | $3,866 | $153,400 | $28,000 | $125,400 |
| 2015 | $3,750 | $165,320 | $28,000 | $137,320 |
| 2014 | $3,750 | $147,300 | $28,000 | $119,300 |
Source: Public Records
Map
Nearby Homes
- 410 N Peach St
- 221 Carrell St
- 214 Texas St
- Lot 46 Moore St
- Lot 45 Moore St
- 0 N Sycamore St
- 10615 N Chestnut St
- 418 Texas St
- 532 Carrell St
- 302 Epps St
- 603 Hospital St
- 18818 Cornelia Fields Ln
- 18723 Buttercup Farms Ln
- 19935 Epona Creek Dr
- 18707 Buttercup Farms Ln
- 18826 Cornelia Fields Ln
- lt 19 Mechanic Rd
- TBD Mechanic St
- 9214 Trimble Landing Dr
- 200 S Cherry St
Your Personal Tour Guide
Ask me questions while you tour the home.