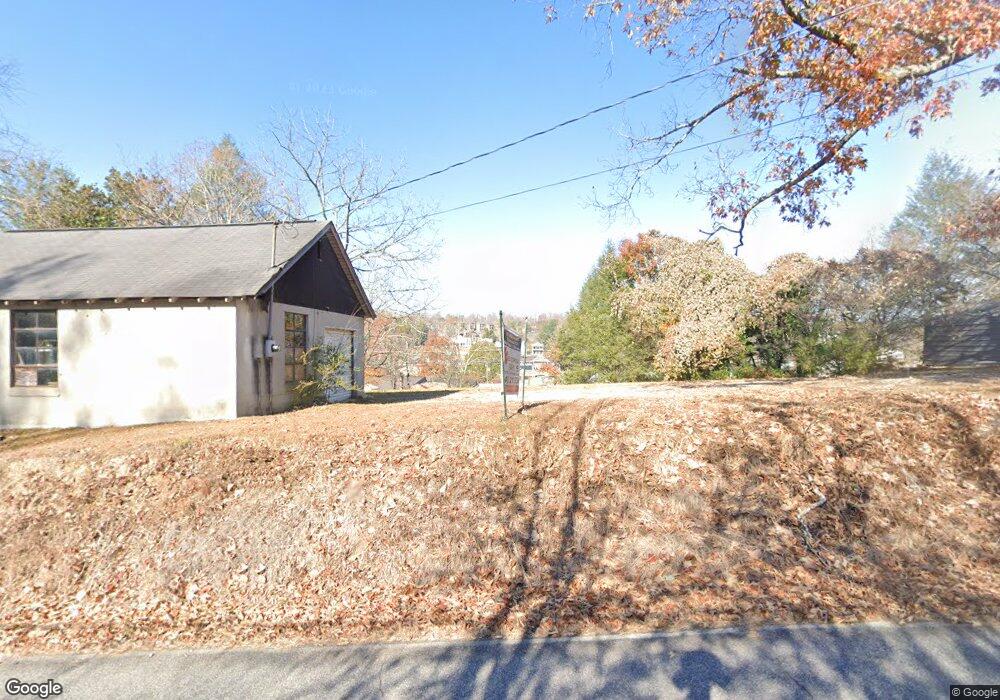
404 Pine Tree Blue Ridge, FL 30513
Estimated Value: $420,219 - $455,000
2
Beds
2
Baths
1,152
Sq Ft
$380/Sq Ft
Est. Value
About This Home
This home is located at 404 Pine Tree, Blue Ridge, FL 30513 and is currently estimated at $438,055, approximately $380 per square foot. 404 Pine Tree is a home located in Fannin County with nearby schools including Fannin County High School.
Ownership History
Date
Name
Owned For
Owner Type
Purchase Details
Closed on
Apr 15, 2025
Sold by
Michaelis Brandon Andrew Lee
Bought by
Sandy Eric
Current Estimated Value
Home Financials for this Owner
Home Financials are based on the most recent Mortgage that was taken out on this home.
Original Mortgage
$394,200
Outstanding Balance
$392,457
Interest Rate
6.67%
Mortgage Type
New Conventional
Estimated Equity
$45,598
Purchase Details
Closed on
Oct 6, 2022
Sold by
Ricks Rustic Retreats Llc
Bought by
Michaelis Brandon Andrew Lee and Michaelis June Deanne
Home Financials for this Owner
Home Financials are based on the most recent Mortgage that was taken out on this home.
Original Mortgage
$294,015
Interest Rate
5.89%
Mortgage Type
New Conventional
Purchase Details
Closed on
Mar 29, 2019
Sold by
Bailey Richard D
Bought by
Ricks Rustic Retreats Llc
Purchase Details
Closed on
Aug 16, 1999
Sold by
Cross Winston H and Cross Ga
Bought by
Bailey Richard D
Create a Home Valuation Report for This Property
The Home Valuation Report is an in-depth analysis detailing your home's value as well as a comparison with similar homes in the area
Home Values in the Area
Average Home Value in this Area
Purchase History
| Date | Buyer | Sale Price | Title Company |
|---|---|---|---|
| Sandy Eric | $438,000 | -- | |
| Michaelis Brandon Andrew Lee | $345,900 | -- | |
| Ricks Rustic Retreats Llc | -- | -- | |
| Bailey Richard D | $93,000 | -- |
Source: Public Records
Mortgage History
| Date | Status | Borrower | Loan Amount |
|---|---|---|---|
| Open | Sandy Eric | $394,200 | |
| Previous Owner | Michaelis Brandon Andrew Lee | $294,015 |
Source: Public Records
Tax History Compared to Growth
Tax History
| Year | Tax Paid | Tax Assessment Tax Assessment Total Assessment is a certain percentage of the fair market value that is determined by local assessors to be the total taxable value of land and additions on the property. | Land | Improvement |
|---|---|---|---|---|
| 2024 | $1,019 | $111,203 | $15,667 | $95,536 |
| 2023 | $937 | $91,917 | $15,667 | $76,250 |
| 2022 | $947 | $92,907 | $15,667 | $77,240 |
| 2021 | $708 | $50,499 | $15,667 | $34,832 |
| 2020 | $720 | $50,499 | $15,667 | $34,832 |
| 2019 | $734 | $50,499 | $15,667 | $34,832 |
| 2018 | $671 | $43,536 | $8,704 | $34,832 |
| 2017 | $778 | $43,946 | $8,704 | $35,242 |
| 2016 | $646 | $38,020 | $8,704 | $29,316 |
| 2015 | $588 | $33,143 | $6,633 | $26,510 |
| 2014 | $622 | $41,193 | $11,749 | $29,444 |
| 2013 | -- | $35,877 | $11,749 | $24,128 |
Source: Public Records
Map
Nearby Homes
- 879 Mill Stone Mountain Ln
- 226 Pinetree Dr
- 416 Mill Stone Mountain Ln
- 399 Pack Creek Rd
- 7590 Mobile Rd
- 445 Twin Creeks Unit 13
- 445 Twin Creeks
- 127 Twin Creeks
- 48 Twin Creeks Unit 27
- 48 Twin Creeks
- 215 Twin Creeks
- 136 Oasis Dr
- 98 Saddle Back Trail
- Lot 14 Pine Grove Dr
- 577 Macedonia Church Rd
- 330 Pine Grove Dr
- 150 Cadence Way
- 0 Mill Creek Acres Unit 7513948
- 0 Mill Creek Acres Unit 10446126
- 0 Mill Creek Acres Unit 412652
- 627 Mill Stone Mountain Ln
- 0 Pinetree Dr Unit 7075745
- 0 Pinetree Dr
- 929 Mill Stone Mountain Ln
- 545 Mill Stone Mountain Ln
- 573 Mill Stone Mountain Ln
- 545 Mill Stone Mountain Ln
- 505 Mill Stone Mountain Ln
- 250 Pinetree Dr
- 0 Millstone Mountain Unit 11C 8372012
- 0 Millstone Mountain Unit 120412
- 0 Mill Stone Mountain Ln Unit 8903561
- 0 Mill Stone Mountain Ln Unit 7635303
- 0 Mill Stone Mountain Ln Unit 8177863
- 0 Mill Stone Mountain Ln Unit 8381080
- 0 Mill Stone Mountain Ln Unit 8402708
- 0 Mill Stone Mountain Ln Unit 8500962
- 459 Mill Stone Mountain Ln
- 808 Mill Stone Mountain Ln
- 808 Mill Stone Mountain Ln Unit 11B128