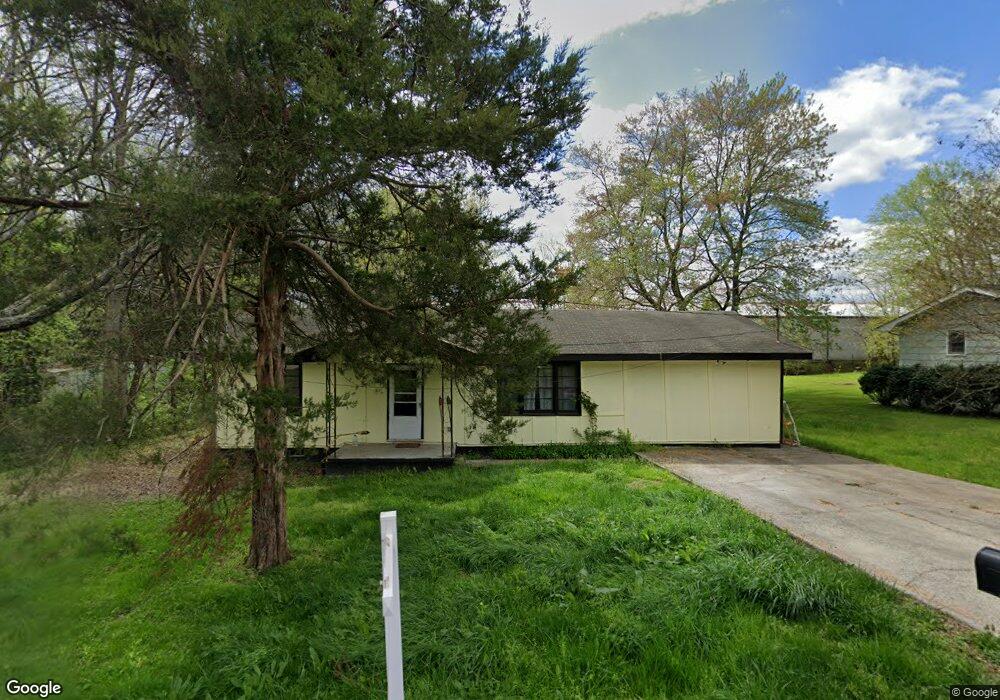
404 Regal Dr Tunnel Hill, GA 30755
Estimated Value: $199,070 - $250,000
4
Beds
2
Baths
1,320
Sq Ft
$167/Sq Ft
Est. Value
About This Home
This home is located at 404 Regal Dr, Tunnel Hill, GA 30755 and is currently estimated at $220,518, approximately $167 per square foot. 404 Regal Dr is a home located in Whitfield County with nearby schools including Tunnel Hill Elementary School, Westside Middle School, and Northwest Whitfield County High School.
Ownership History
Date
Name
Owned For
Owner Type
Purchase Details
Closed on
Dec 20, 2021
Sold by
Crow Road Holdings Llc
Bought by
Ranguel Jose
Current Estimated Value
Purchase Details
Closed on
Dec 9, 2021
Sold by
Brock Donald L Estate
Bought by
Crow Road Holdings Llc
Purchase Details
Closed on
Dec 8, 2021
Sold by
Brock Jerry M Estate
Bought by
Crow Road Holdings Llc
Purchase Details
Closed on
Oct 12, 2021
Sold by
Brock Randy
Bought by
Crow Road Holdings Llc
Purchase Details
Closed on
Oct 9, 2021
Sold by
Brock Donald Lee
Bought by
Crow Road Holdings Llc
Purchase Details
Closed on
Aug 30, 2007
Sold by
Brock Dennis M
Bought by
Brock Jerry M
Create a Home Valuation Report for This Property
The Home Valuation Report is an in-depth analysis detailing your home's value as well as a comparison with similar homes in the area
Home Values in the Area
Average Home Value in this Area
Purchase History
| Date | Buyer | Sale Price | Title Company |
|---|---|---|---|
| Ranguel Jose | $62,000 | -- | |
| Crow Road Holdings Llc | $55,000 | -- | |
| Crow Road Holdings Llc | -- | -- | |
| Crow Road Holdings Llc | -- | -- | |
| Crow Road Holdings Llc | -- | -- | |
| Brock Jerry M | -- | -- |
Source: Public Records
Tax History Compared to Growth
Tax History
| Year | Tax Paid | Tax Assessment Tax Assessment Total Assessment is a certain percentage of the fair market value that is determined by local assessors to be the total taxable value of land and additions on the property. | Land | Improvement |
|---|---|---|---|---|
| 2024 | $1,341 | $70,518 | $9,000 | $61,518 |
| 2023 | $1,341 | $44,320 | $4,200 | $40,120 |
| 2022 | $726 | $24,628 | $4,200 | $20,428 |
| 2021 | $50 | $24,628 | $4,200 | $20,428 |
| 2020 | $22 | $21,861 | $1,433 | $20,428 |
| 2019 | $23 | $21,861 | $1,433 | $20,428 |
| 2018 | $21 | $21,626 | $1,198 | $20,428 |
| 2017 | $21 | $21,626 | $1,198 | $20,428 |
| 2016 | $0 | $19,777 | $1,198 | $18,579 |
| 2014 | -- | $19,901 | $1,322 | $18,579 |
| 2013 | -- | $19,901 | $1,322 | $18,579 |
Source: Public Records
Map
Nearby Homes
- 203 S Cherry St
- 107 N Varnell Rd
- 3414 Chattanooga Rd
- 00 Old Chattanooga Rd
- Lot 47 Robert Fuller Rd
- Lot 51 Robert Fuller Rd
- Lot 43 Robert Fuller Rd
- Lot 28 Robert Fuller Rd
- Lot 45 Robert Fuller Rd
- Lot 44 Robert Fuller Rd
- 0 Mount View Dr Unit 1517505
- 0 Mount View Dr Unit RTC2958565
- 400 Crawford Terrace
- Lot 38 Keys Battery Ln
- Lot 42 Keys Battery Ln
- Lot 39 Keys Battery Ln
- Lot 30 Pat Cleburne Ln
- Lot 37 Pat Cleburne Ln
- 0 Dockwell Unit 1517509
- 0 Dockwell Unit RTC2958569
- 402 Regal Dr
- 406 Regal Dr
- 119 S Varnell Rd
- 191 Tunnel Hill Main St
- 187 Tunnel Hill Main St
- 191 Tunnel Hill Main St
- 403 Regal Dr
- 400 Regal Dr
- 100 Broad St
- 401 Regal Dr
- 187 Main St
- 408 Regal Dr
- 116 S Varnell Rd
- 102 Broad St
- 124 S Varnell Rd
- 1804 S Varnell Rd
- 105 S Varnell Rd
- 120 S Varnell Rd
- 126 S Varnell Rd
- 2881 Dogwood St