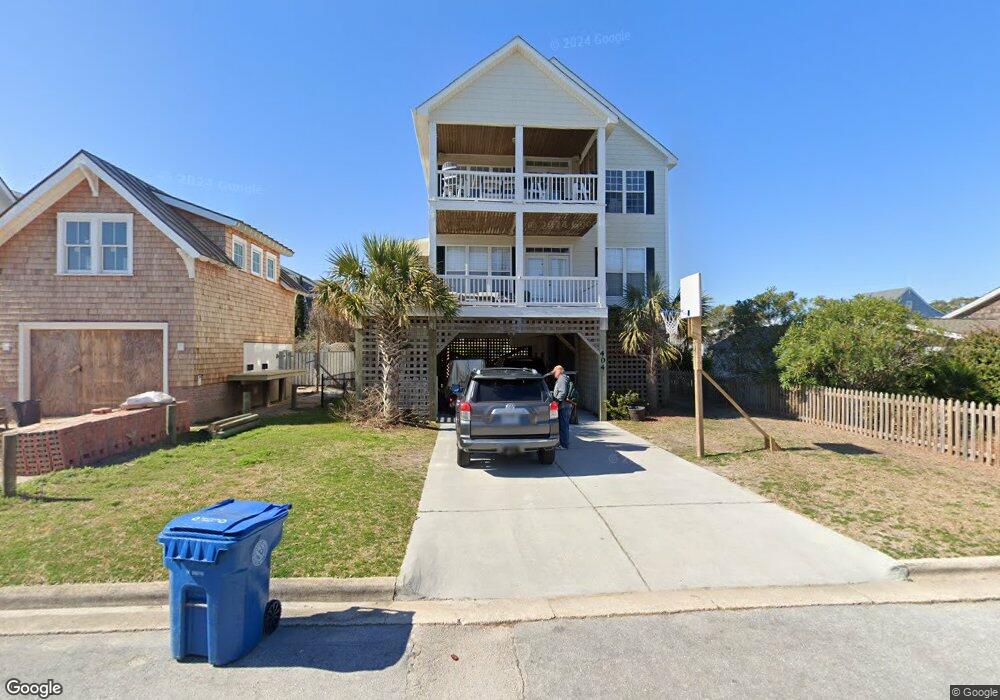
404 S 14th St Morehead City, NC 28557
Estimated Value: $960,000 - $1,044,000
3
Beds
3
Baths
2,436
Sq Ft
$413/Sq Ft
Est. Value
About This Home
This home is located at 404 S 14th St, Morehead City, NC 28557 and is currently estimated at $1,005,262, approximately $412 per square foot. 404 S 14th St is a home located in Carteret County with nearby schools including Morehead City Primary School, Morehead Elementary School at Camp Glenn, and Morehead City Middle School.
Ownership History
Date
Name
Owned For
Owner Type
Purchase Details
Closed on
Apr 15, 2010
Sold by
Roney John R and Roney Candace Byrd
Bought by
Roney John R and Roney Candace B
Current Estimated Value
Purchase Details
Closed on
May 7, 2009
Sold by
Roney John R and Roney Billie D
Bought by
Roney John Robert
Home Financials for this Owner
Home Financials are based on the most recent Mortgage that was taken out on this home.
Original Mortgage
$417,000
Outstanding Balance
$262,618
Interest Rate
4.79%
Mortgage Type
New Conventional
Estimated Equity
$742,644
Purchase Details
Closed on
Jan 16, 2006
Sold by
Stec #05-2215 Llc
Bought by
Roney John R and Roney Billie Peele
Purchase Details
Closed on
Jun 22, 2005
Sold by
Bogue Homes Inc
Bought by
Roney John R and Roney Billie R
Purchase Details
Closed on
Jan 28, 2002
Create a Home Valuation Report for This Property
The Home Valuation Report is an in-depth analysis detailing your home's value as well as a comparison with similar homes in the area
Home Values in the Area
Average Home Value in this Area
Purchase History
| Date | Buyer | Sale Price | Title Company |
|---|---|---|---|
| Roney John R | -- | None Available | |
| Roney John Robert | -- | None Available | |
| Roney John R | -- | None Available | |
| Roney John R | $688,500 | None Available | |
| -- | -- | -- |
Source: Public Records
Mortgage History
| Date | Status | Borrower | Loan Amount |
|---|---|---|---|
| Open | Roney John Robert | $417,000 |
Source: Public Records
Tax History Compared to Growth
Tax History
| Year | Tax Paid | Tax Assessment Tax Assessment Total Assessment is a certain percentage of the fair market value that is determined by local assessors to be the total taxable value of land and additions on the property. | Land | Improvement |
|---|---|---|---|---|
| 2025 | $6,446 | $1,118,555 | $435,010 | $683,545 |
| 2024 | $3,578 | $463,974 | $242,287 | $221,687 |
| 2023 | $1,593 | $463,974 | $242,287 | $221,687 |
| 2022 | $1,546 | $463,974 | $242,287 | $221,687 |
| 2021 | $1,546 | $463,974 | $242,287 | $221,687 |
| 2020 | $1,546 | $463,974 | $242,287 | $221,687 |
| 2019 | $1,461 | $466,582 | $237,672 | $228,910 |
| 2017 | $1,461 | $466,582 | $237,672 | $228,910 |
| 2016 | $1,461 | $466,582 | $237,672 | $228,910 |
| 2015 | $1,415 | $466,582 | $237,672 | $228,910 |
| 2014 | $1,742 | $575,635 | $240,900 | $334,735 |
Source: Public Records
Map
Nearby Homes
- 1405 Shackleford St
- 406 S 14th St
- 1403 Shackleford St
- 1404 Patterson St
- 403 S 14th St
- 1407 Shackleford St
- 405 S 14th St
- 1313 Shackleford St
- 1406 Patterson St
- 1311 Shackleford St
- 1310 Patterson St
- 1408 Patterson St
- 1309 Shackleford St
- 1308 Patterson St
- 1411 Shackleford St
- 405 S 15th St
- 1312 Shackleford St
- 1409 Shackleford St
- 1406 Shackleford St
- 501 S 14th St