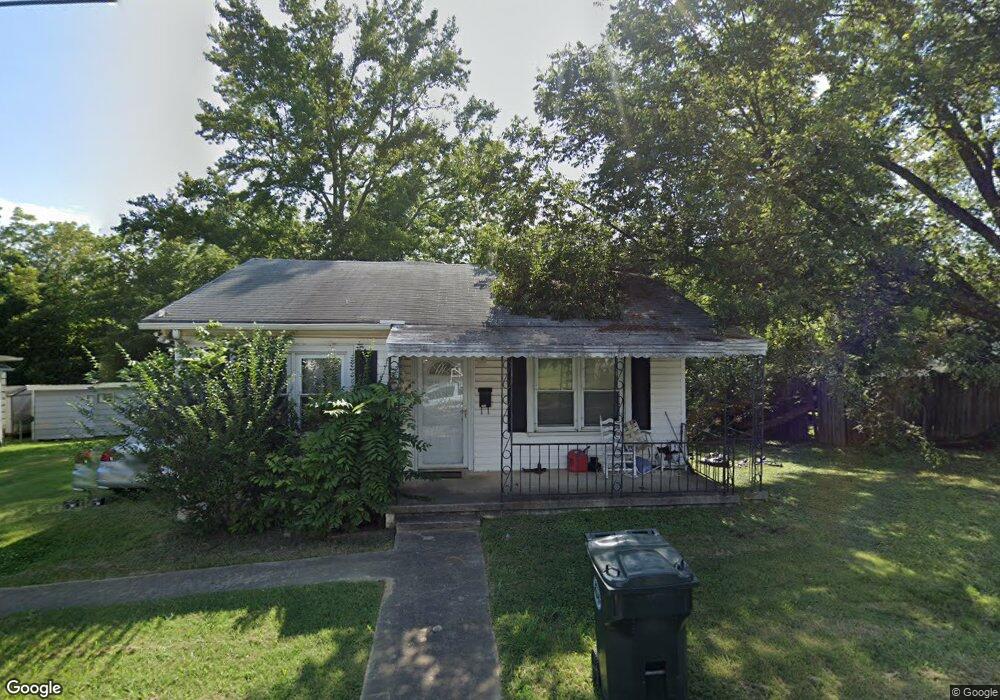
404 S Jacob St Cherryville, NC 28021
Estimated Value: $147,264 - $182,000
2
Beds
1
Bath
744
Sq Ft
$229/Sq Ft
Est. Value
About This Home
This home is located at 404 S Jacob St, Cherryville, NC 28021 and is currently estimated at $170,066, approximately $228 per square foot. 404 S Jacob St is a home located in Gaston County with nearby schools including Cherryville Elementary School, William B. Beam Intermediate School, and John Chavis Middle School.
Ownership History
Date
Name
Owned For
Owner Type
Purchase Details
Closed on
Nov 10, 2017
Sold by
Smith Elizabeth M
Bought by
Ramsey Gerald
Current Estimated Value
Purchase Details
Closed on
Nov 7, 2005
Sold by
Fifth Third Mortgage Co
Bought by
Smith Elizabeth Mary
Home Financials for this Owner
Home Financials are based on the most recent Mortgage that was taken out on this home.
Original Mortgage
$7,500
Interest Rate
6.1%
Mortgage Type
Fannie Mae Freddie Mac
Purchase Details
Closed on
Aug 3, 2004
Sold by
Rhyne Michael Ray
Bought by
Fifth Third Mortgage Co
Purchase Details
Closed on
Feb 27, 2001
Sold by
Pearson Roy W and Pearson Karen W
Bought by
Rhyne Michael Ray
Home Financials for this Owner
Home Financials are based on the most recent Mortgage that was taken out on this home.
Original Mortgage
$55,500
Interest Rate
7.06%
Mortgage Type
FHA
Create a Home Valuation Report for This Property
The Home Valuation Report is an in-depth analysis detailing your home's value as well as a comparison with similar homes in the area
Home Values in the Area
Average Home Value in this Area
Purchase History
| Date | Buyer | Sale Price | Title Company |
|---|---|---|---|
| Ramsey Gerald | $12,045 | None Available | |
| Smith Elizabeth Mary | $37,500 | -- | |
| Fifth Third Mortgage Co | $22,994 | -- | |
| Rhyne Michael Ray | $54,000 | -- |
Source: Public Records
Mortgage History
| Date | Status | Borrower | Loan Amount |
|---|---|---|---|
| Previous Owner | Smith Elizabeth Mary | $7,500 | |
| Previous Owner | Smith Elizabeth Mary | $30,000 | |
| Previous Owner | Rhyne Michael Ray | $55,500 |
Source: Public Records
Tax History
| Year | Tax Paid | Tax Assessment Tax Assessment Total Assessment is a certain percentage of the fair market value that is determined by local assessors to be the total taxable value of land and additions on the property. | Land | Improvement |
|---|---|---|---|---|
| 2025 | $1,258 | $116,630 | $10,630 | $106,000 |
| 2024 | $1,258 | $116,630 | $10,630 | $106,000 |
| 2023 | $1,271 | $114,630 | $10,630 | $104,000 |
| 2022 | $726 | $54,570 | $8,500 | $46,070 |
| 2021 | $1,525 | $54,570 | $8,500 | $46,070 |
| 2019 | $709 | $54,570 | $8,500 | $46,070 |
| 2018 | $543 | $40,828 | $6,000 | $34,828 |
| 2017 | $543 | $40,828 | $6,000 | $34,828 |
| 2016 | $543 | $40,828 | $0 | $0 |
| 2014 | $639 | $48,015 | $10,500 | $37,515 |
Source: Public Records
Map
Nearby Homes
- 303 S Pink St
- 404 S Mulberry St
- 519 S Mulberry St
- 301 Jc Dellinger Rd
- 600 Queens Rd
- 117 W Main St
- 103 W Irwin St
- 327 J C Dellinger Rd
- 709 E Main St
- 210 W Church St
- 411 N Mulberry St
- 500 N Mountain St
- 901 E Church St
- 416 N Pine St
- 805 W Church St
- 507 N Mulberry St
- 422 N Pine St
- 510 N Mulberry St
- 514 N Mulberry St
- 516 N Mulberry St
- 406 S Jacob St
- 402 S Jacob St
- 405 S Jacob St
- 403 S Jacob St
- 110 E Ballard St
- 112 E Ballard St
- 401 S Jacob St
- 407 S Jacob St
- 106 E Ballard St
- 118 Angle St
- 317 S Jacob St
- 109 E Ballard St
- 104 E Ballard St
- 315 S Jacob St
- 201 E Ballard St
- 326 S Pink St
- 411 S Jacob St
- 102 E Ballard St
- 105 E Ballard St
- 322 S Pink St
Your Personal Tour Guide
Ask me questions while you tour the home.