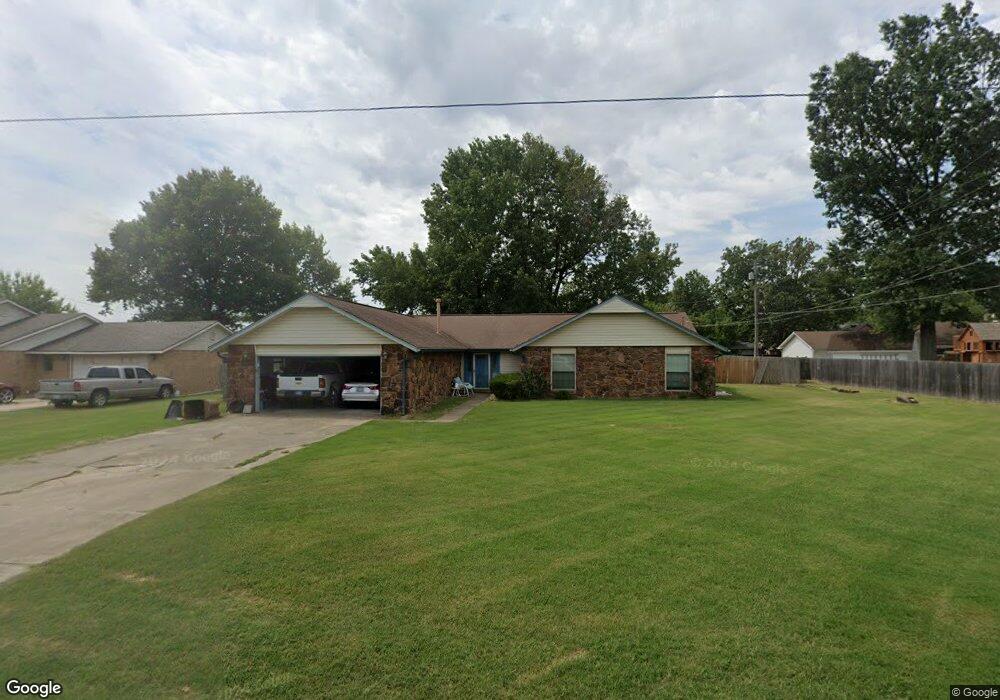
404 S Susan Ave Wagoner, OK 74467
Estimated Value: $242,098 - $356,000
--
Bed
2
Baths
2,172
Sq Ft
$138/Sq Ft
Est. Value
About This Home
This home is located at 404 S Susan Ave, Wagoner, OK 74467 and is currently estimated at $300,525, approximately $138 per square foot. 404 S Susan Ave is a home located in Wagoner County with nearby schools including Ellington Elementary School, William R. Teague Elementary School, and Wagoner Middle School.
Ownership History
Date
Name
Owned For
Owner Type
Purchase Details
Closed on
Feb 9, 2023
Sold by
Morgan Jean Ann and Morgan Gary
Bought by
Jean Ann Morgan Revocable Trust
Current Estimated Value
Purchase Details
Closed on
Jul 11, 2008
Sold by
The Jean Morgan Revocable Trust
Bought by
Morgan Jean and Morgan Gary
Home Financials for this Owner
Home Financials are based on the most recent Mortgage that was taken out on this home.
Original Mortgage
$75,000
Interest Rate
5.24%
Mortgage Type
New Conventional
Purchase Details
Closed on
Sep 18, 2007
Sold by
Sisco Jerry and Sisco Keri
Bought by
Sweet Jerry L
Home Financials for this Owner
Home Financials are based on the most recent Mortgage that was taken out on this home.
Original Mortgage
$3,900
Interest Rate
6.55%
Mortgage Type
Unknown
Purchase Details
Closed on
Jul 7, 2003
Sold by
Neighbors Betty
Purchase Details
Closed on
Mar 24, 1994
Sold by
Dorris Imogene and Jo Ann
Create a Home Valuation Report for This Property
The Home Valuation Report is an in-depth analysis detailing your home's value as well as a comparison with similar homes in the area
Home Values in the Area
Average Home Value in this Area
Purchase History
| Date | Buyer | Sale Price | Title Company |
|---|---|---|---|
| Jean Ann Morgan Revocable Trust | -- | -- | |
| Morgan Jean | -- | Multiple | |
| Sweet Jerry L | $163,000 | Metro Abstract & Title | |
| -- | -- | -- | |
| -- | $65,000 | -- |
Source: Public Records
Mortgage History
| Date | Status | Borrower | Loan Amount |
|---|---|---|---|
| Previous Owner | Morgan Jean | $75,000 | |
| Previous Owner | Sweet Jerry L | $3,900 | |
| Previous Owner | Sweet Jerry L | $3,900 |
Source: Public Records
Tax History Compared to Growth
Tax History
| Year | Tax Paid | Tax Assessment Tax Assessment Total Assessment is a certain percentage of the fair market value that is determined by local assessors to be the total taxable value of land and additions on the property. | Land | Improvement |
|---|---|---|---|---|
| 2025 | $1,484 | $17,578 | $309 | $17,269 |
| 2024 | $1,484 | $17,065 | $300 | $16,765 |
| 2023 | $1,438 | $16,568 | $293 | $16,275 |
| 2022 | $1,390 | $16,086 | $285 | $15,801 |
| 2021 | $1,354 | $15,617 | $284 | $15,333 |
| 2020 | $1,343 | $15,163 | $283 | $14,880 |
| 2019 | $1,120 | $14,721 | $270 | $14,451 |
| 2018 | $1,149 | $14,293 | $175 | $14,118 |
| 2017 | $1,097 | $13,877 | $175 | $13,702 |
| 2016 | $1,033 | $13,472 | $175 | $13,297 |
| 2015 | $1,013 | $13,080 | $175 | $12,905 |
| 2014 | $984 | $12,699 | $1,344 | $11,355 |
Source: Public Records
Map
Nearby Homes
- 312 Roosevelt Ave
- 311 Roosevelt Ave
- 308 Roosevelt Ave
- 1807 SW 2nd Place
- 122 Yorkshire Blvd
- 1 Ash Ave
- 73055 S 262nd
- 74499 280
- 69 S 270 Rd
- 1 S 270 Rd
- 60 E 740 Rd
- 1202 SW 9th St
- 0 S Grant Ave
- 1314 Ford Circle Dr
- 405 Mockingbird Ln
- 406 Mockingbird Ln
- 0 SW 4th St
- 517 Park St
- 519 Park St
- 1204 SW 12th Place
- 408 S Susan Ave
- 1803 SW 4th St
- 1805 SW 4th St
- 407 S Susan Ave
- 407 S Susan Ave
- 313 Roosevelt Ave
- 1807 SW 4th St
- 319 S Susan Ave
- 504 S Susan Ave
- 1809 SW 4th St
- 402 S Mary Ave
- 1808 SW 4th St
- 1516 State Highway 51
- 1516 State Highway 51
- 1516 State Highway 51
- 505 S Susan Ave
- 1810 SW 4th St
- 309 Roosevelt Ave
- 315 S Susan Ave
- 1811 SW 4th St