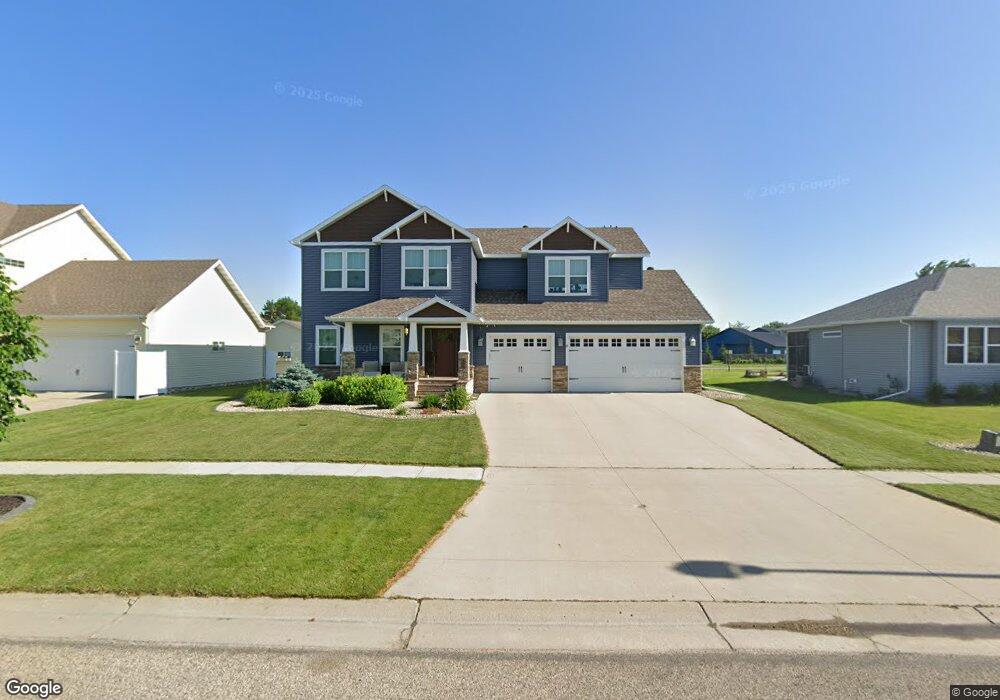
404 Sequoia Dr Mapleton, ND 58059
Estimated Value: $528,000 - $549,000
4
Beds
4
Baths
3,053
Sq Ft
$175/Sq Ft
Est. Value
About This Home
This home is located at 404 Sequoia Dr, Mapleton, ND 58059 and is currently estimated at $534,499, approximately $175 per square foot. 404 Sequoia Dr is a home located in Cass County with nearby schools including Mapleton Elementary School.
Ownership History
Date
Name
Owned For
Owner Type
Purchase Details
Closed on
Jul 27, 2017
Sold by
Anderson Brett M and Anderson Nicole M
Bought by
Kuehnemund Jon W and Kuehnemund Angela S
Current Estimated Value
Home Financials for this Owner
Home Financials are based on the most recent Mortgage that was taken out on this home.
Original Mortgage
$308,000
Outstanding Balance
$256,655
Interest Rate
3.91%
Mortgage Type
New Conventional
Estimated Equity
$277,844
Purchase Details
Closed on
Aug 30, 2012
Sold by
Johnson Ryan C and Johnson Ashley M
Bought by
Anderson Brett M and Anderson Nicole M
Home Financials for this Owner
Home Financials are based on the most recent Mortgage that was taken out on this home.
Original Mortgage
$269,822
Interest Rate
3.52%
Mortgage Type
New Conventional
Purchase Details
Closed on
Mar 30, 2012
Sold by
Meridian Grove Inc
Bought by
Johnson Ryan C and Johnson Ashley M
Create a Home Valuation Report for This Property
The Home Valuation Report is an in-depth analysis detailing your home's value as well as a comparison with similar homes in the area
Purchase History
| Date | Buyer | Sale Price | Title Company |
|---|---|---|---|
| Kuehnemund Jon W | $418,000 | Title Co | |
| Anderson Brett M | $337,278 | None Available | |
| Johnson Ryan C | -- | U S Title & Closing |
Source: Public Records
Mortgage History
| Date | Status | Borrower | Loan Amount |
|---|---|---|---|
| Open | Kuehnemund Jon W | $308,000 | |
| Previous Owner | Anderson Brett M | $269,822 |
Source: Public Records
Tax History
| Year | Tax Paid | Tax Assessment Tax Assessment Total Assessment is a certain percentage of the fair market value that is determined by local assessors to be the total taxable value of land and additions on the property. | Land | Improvement |
|---|---|---|---|---|
| 2024 | $8,231 | $263,550 | $28,850 | $234,700 |
| 2023 | $8,561 | $262,150 | $28,850 | $233,300 |
| 2022 | $7,876 | $240,650 | $28,850 | $211,800 |
| 2021 | $7,653 | $224,850 | $28,850 | $196,000 |
| 2020 | $7,478 | $223,900 | $28,850 | $195,050 |
| 2019 | $7,426 | $223,900 | $28,850 | $195,050 |
| 2018 | $9,754 | $222,000 | $28,850 | $193,150 |
| 2017 | $8,839 | $201,350 | $19,550 | $181,800 |
| 2016 | $7,929 | $195,500 | $17,800 | $177,700 |
| 2015 | $7,475 | $181,050 | $16,500 | $164,550 |
| 2014 | $4,440 | $89,600 | $15,000 | $74,600 |
| 2013 | $4,482 | $89,600 | $15,000 | $74,600 |
Source: Public Records
Map
Nearby Homes
Your Personal Tour Guide
Ask me questions while you tour the home.