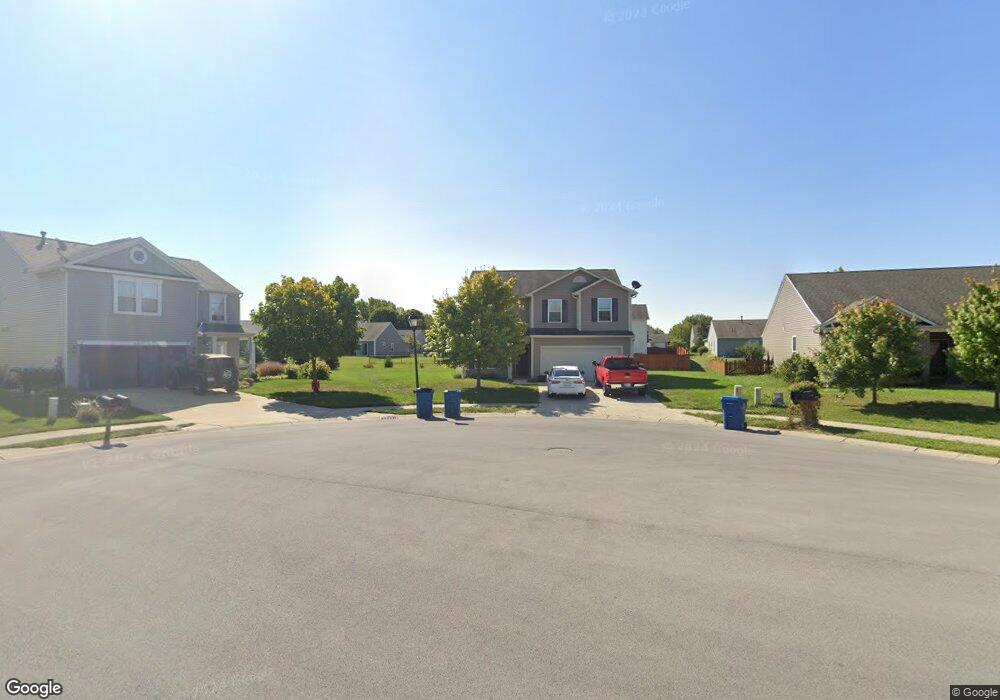
404 Shade Tree Ct Sheridan, IN 46069
Estimated Value: $310,000 - $332,000
3
Beds
3
Baths
2,124
Sq Ft
$150/Sq Ft
Est. Value
About This Home
This home is located at 404 Shade Tree Ct, Sheridan, IN 46069 and is currently estimated at $319,520, approximately $150 per square foot. 404 Shade Tree Ct is a home located in Hamilton County with nearby schools including Sheridan Elementary School, Sheridan Middle School, and Sheridan High School.
Ownership History
Date
Name
Owned For
Owner Type
Purchase Details
Closed on
Aug 18, 2023
Sold by
Clardy Sadie
Bought by
Michaelis Elliot T
Current Estimated Value
Home Financials for this Owner
Home Financials are based on the most recent Mortgage that was taken out on this home.
Original Mortgage
$265,500
Outstanding Balance
$259,190
Interest Rate
6.81%
Mortgage Type
VA
Estimated Equity
$60,330
Purchase Details
Closed on
Mar 21, 2018
Sold by
Ramirez-Velez Angel M
Bought by
Sadie Clardy
Purchase Details
Closed on
Mar 20, 2018
Sold by
Ramirez Velez Angel M
Bought by
Clardy Sadie
Purchase Details
Closed on
Jan 31, 2013
Sold by
Westport Homes Inc
Bought by
Ramirez Valez Angel M
Home Financials for this Owner
Home Financials are based on the most recent Mortgage that was taken out on this home.
Original Mortgage
$127,551
Interest Rate
3.32%
Mortgage Type
New Conventional
Create a Home Valuation Report for This Property
The Home Valuation Report is an in-depth analysis detailing your home's value as well as a comparison with similar homes in the area
Home Values in the Area
Average Home Value in this Area
Purchase History
| Date | Buyer | Sale Price | Title Company |
|---|---|---|---|
| Michaelis Elliot T | -- | Enterprise Title | |
| Sadie Clardy | $164,900 | -- | |
| Clardy Sadie | $164,900 | Hocker And Associates | |
| Clardy Sadie | -- | Guardian Title Agency Llc | |
| Ramirez Valez Angel M | -- | None Available |
Source: Public Records
Mortgage History
| Date | Status | Borrower | Loan Amount |
|---|---|---|---|
| Open | Michaelis Elliot T | $265,500 | |
| Previous Owner | Ramirez Valez Angel M | $127,551 |
Source: Public Records
Tax History Compared to Growth
Tax History
| Year | Tax Paid | Tax Assessment Tax Assessment Total Assessment is a certain percentage of the fair market value that is determined by local assessors to be the total taxable value of land and additions on the property. | Land | Improvement |
|---|---|---|---|---|
| 2024 | $2,450 | $239,400 | $35,000 | $204,400 |
| 2023 | $2,485 | $219,300 | $35,000 | $184,300 |
| 2022 | $2,149 | $188,100 | $35,000 | $153,100 |
| 2021 | $2,015 | $176,600 | $35,000 | $141,600 |
| 2020 | $1,859 | $163,200 | $35,000 | $128,200 |
| 2019 | $1,782 | $156,600 | $18,200 | $138,400 |
| 2018 | $1,718 | $151,700 | $18,200 | $133,500 |
| 2017 | $1,547 | $137,000 | $18,200 | $118,800 |
| 2016 | $1,440 | $130,500 | $18,200 | $112,300 |
| 2014 | $1,387 | $128,900 | $31,900 | $97,000 |
| 2013 | $1,387 | $128,900 | $31,900 | $97,000 |
Source: Public Records
Map
Nearby Homes
- 413 Shadetree Ct
- 21650 Mule Barn Rd
- 1225 Maple Trace Way
- 1300 Shadetree Ln
- 1224 Maple Trace Way
- 1134 Maple Trace Way
- 511 Tomahawk St
- 1102 Maple Run Dr
- Spruce Plan at Maple Run
- Chestnut Plan at Maple Run
- Juniper Plan at Maple Run
- Empress Plan at Maple Run
- Aspen II Plan at Maple Run
- Ironwood Plan at Maple Run
- Bradford Plan at Maple Run
- Walnut Plan at Maple Run
- Ashton Plan at Maple Run
- Palmetto Plan at Maple Run
- Cooper Plan at Maple Run
- Norway Plan at Maple Run
- 404 Shadetree Ct
- 406 Shade Tree Ct
- 402 Shade Tree Ct
- 408 Shadetree Ct
- 408 Shade Tree Ct
- 311 S Shade Tree Ln
- 403 Shade Tree Ln
- 400 Shadetree Ct
- 400 Shade Tree Ct
- 309 Shadetree Ln
- 309 Shade Tree Ln
- 405 Shade Tree Ln
- 405 Shadetree Ln
- 410 Shade Tree Ct
- 410 Shadetree Ct
- 405 Shade Tree Ct
- 407 Shadetree Ct
- 401 Shade Tree Ct
- 307 S Shade Tree Ln