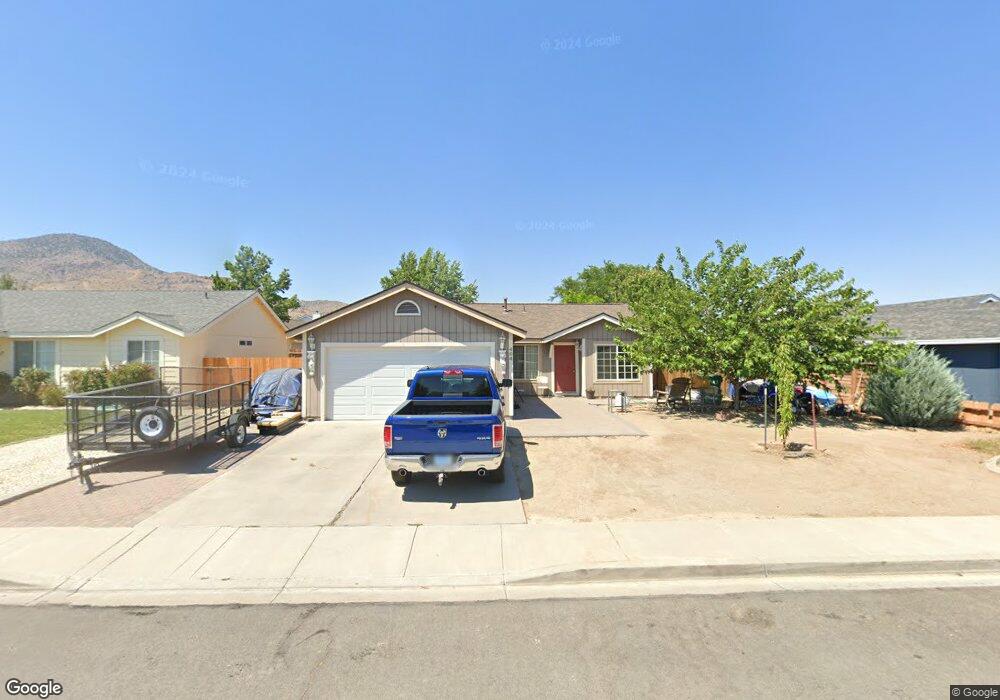
404 Sheep Camp Dr Dayton, NV 89403
Estimated Value: $352,513 - $374,000
3
Beds
2
Baths
1,098
Sq Ft
$334/Sq Ft
Est. Value
About This Home
This home is located at 404 Sheep Camp Dr, Dayton, NV 89403 and is currently estimated at $366,378, approximately $333 per square foot. 404 Sheep Camp Dr is a home located in Lyon County with nearby schools including Sutro Elementary School, Dayton Intermediate School, and Dayton High School.
Ownership History
Date
Name
Owned For
Owner Type
Purchase Details
Closed on
Jun 27, 2008
Sold by
Avila Rosa Elena
Bought by
Lopez Jose A and Avila Lopez Jose
Current Estimated Value
Home Financials for this Owner
Home Financials are based on the most recent Mortgage that was taken out on this home.
Original Mortgage
$106,500
Interest Rate
6%
Mortgage Type
New Conventional
Purchase Details
Closed on
May 9, 2006
Sold by
Avila Lopez Jose
Bought by
Avila Lopez Jose and Avila Rosa Elena
Home Financials for this Owner
Home Financials are based on the most recent Mortgage that was taken out on this home.
Original Mortgage
$100,000
Interest Rate
7.47%
Mortgage Type
New Conventional
Purchase Details
Closed on
May 5, 2006
Sold by
Avila Rosa Elena
Bought by
Lopez Jose Avila
Home Financials for this Owner
Home Financials are based on the most recent Mortgage that was taken out on this home.
Original Mortgage
$100,000
Interest Rate
7.47%
Mortgage Type
New Conventional
Create a Home Valuation Report for This Property
The Home Valuation Report is an in-depth analysis detailing your home's value as well as a comparison with similar homes in the area
Home Values in the Area
Average Home Value in this Area
Purchase History
| Date | Buyer | Sale Price | Title Company |
|---|---|---|---|
| Lopez Jose A | -- | First American Title Ins Co | |
| Avila Lopez Jose | -- | Ticor Title Of Nevada Inc | |
| Lopez Jose Avila | -- | Ticor Title Of Nevada Inc |
Source: Public Records
Mortgage History
| Date | Status | Borrower | Loan Amount |
|---|---|---|---|
| Closed | Lopez Jose A | $106,500 | |
| Closed | Lopez Jose Avila | $100,000 |
Source: Public Records
Tax History Compared to Growth
Tax History
| Year | Tax Paid | Tax Assessment Tax Assessment Total Assessment is a certain percentage of the fair market value that is determined by local assessors to be the total taxable value of land and additions on the property. | Land | Improvement |
|---|---|---|---|---|
| 2025 | $1,739 | $89,704 | $52,500 | $37,204 |
| 2024 | $1,610 | $90,123 | $52,500 | $37,622 |
| 2023 | $1,610 | $87,901 | $52,500 | $35,401 |
| 2022 | $1,194 | $76,526 | $43,785 | $32,741 |
| 2021 | $1,105 | $75,852 | $43,785 | $32,067 |
| 2020 | $1,023 | $74,671 | $43,790 | $30,881 |
| 2019 | $959 | $50,961 | $21,000 | $29,961 |
| 2018 | $913 | $50,330 | $21,000 | $29,330 |
| 2017 | $876 | $43,433 | $14,000 | $29,433 |
| 2016 | $854 | $35,110 | $7,880 | $27,230 |
| 2015 | $852 | $28,001 | $7,880 | $20,121 |
| 2014 | $826 | $25,563 | $7,880 | $17,683 |
Source: Public Records
Map
Nearby Homes
- 298 Monte Cristo Dr
- 628 Rock Island Dr
- 539 Rawe Peak Dr
- 300 Golden Pick Dr
- 201 Crown Point Dr
- 7017 Highway 50 Unit 61
- 214 Green Ln
- 618 Union Rd
- 618 Union Rd Unit Lot 67
- 463 Sheep Camp Dr
- 608 Westwinds Dr
- 467 Sheep Camp Dr
- 470 Sheep Camp Dr
- 469 Sheep Camp Dr
- 471 Sheep Camp Dr Unit Lot 139
- The Gem Plan at Gold Sky
- The Haven Plan at Gold Sky
- The Cottonwood Plan at Oro Hills at Traditions
- The Highland Plan at Oro Hills at Traditions
- The La Mesa Plan at Oro Hills at Traditions
- 406 Sheep Camp Dr
- 402 Sheep Camp Dr
- 507 Rawe Peak Dr
- 505 Rawe Peak Dr
- 408 Sheep Camp Dr
- 400 Sheep Camp
- 503 Rawe Peak Dr
- 509 Rawe Peak Dr
- 400 Sheep Camp Dr
- 407 Sheep Camp Dr
- 409 Sheepcamp Dr
- 405 Sheep Camp Dr
- 409 Sheep Camp Dr
- 501 Rawe Peak Dr
- 403 Sheep Camp Dr
- 411 Sheepcamp Dr
- 511 Rawe Peak Dr
- 411 Sheep Camp Dr
- 506 Santiago Way
- 508 Santiago Way