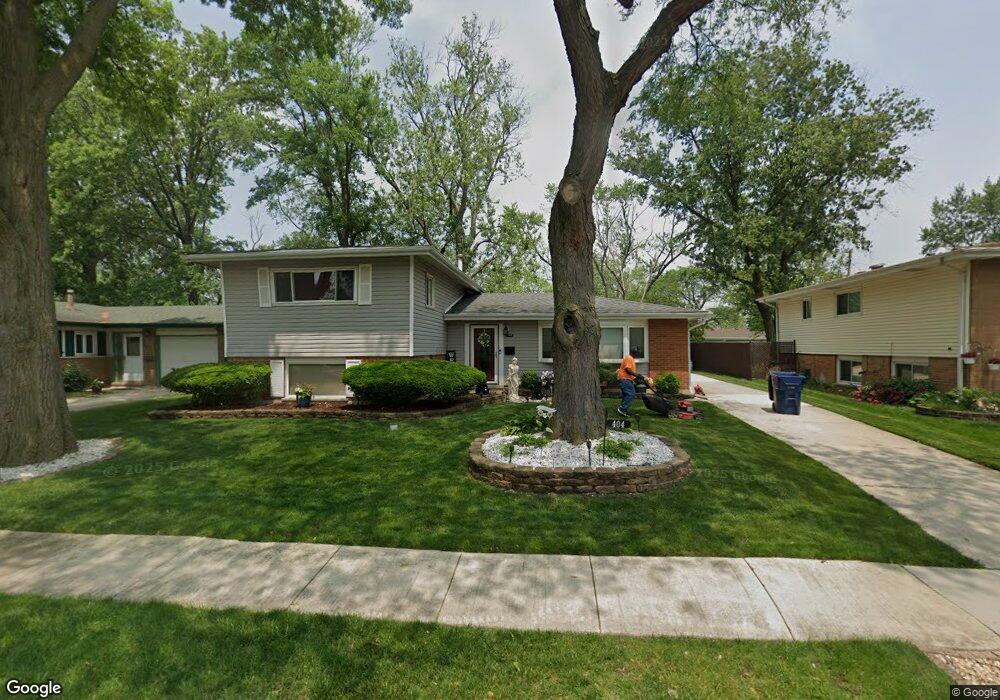
404 Sherman St Park Forest, IL 60466
Estimated Value: $167,000 - $207,000
3
Beds
2
Baths
1,337
Sq Ft
$141/Sq Ft
Est. Value
About This Home
This home is located at 404 Sherman St, Park Forest, IL 60466 and is currently estimated at $188,650, approximately $141 per square foot. 404 Sherman St is a home located in Cook County with nearby schools including Illinois School, Indiana Elementary School, and Arcadia Elementary School.
Ownership History
Date
Name
Owned For
Owner Type
Purchase Details
Closed on
Dec 27, 2024
Sold by
Carroll Lisa A
Bought by
Carroll Lisa A and Drake Ontario
Current Estimated Value
Purchase Details
Closed on
Jun 30, 2006
Sold by
Rademacher Karl D and Rademacher Susan R
Bought by
Carroll Lisa A
Home Financials for this Owner
Home Financials are based on the most recent Mortgage that was taken out on this home.
Original Mortgage
$139,920
Interest Rate
8.65%
Mortgage Type
Unknown
Purchase Details
Closed on
Apr 30, 1997
Sold by
Weissgerber Alfred W and Weissgerber Carol
Bought by
Rademacher Karl D and Rademacher Susan R
Home Financials for this Owner
Home Financials are based on the most recent Mortgage that was taken out on this home.
Original Mortgage
$104,500
Interest Rate
8.24%
Create a Home Valuation Report for This Property
The Home Valuation Report is an in-depth analysis detailing your home's value as well as a comparison with similar homes in the area
Home Values in the Area
Average Home Value in this Area
Purchase History
| Date | Buyer | Sale Price | Title Company |
|---|---|---|---|
| Carroll Lisa A | -- | None Listed On Document | |
| Carroll Lisa A | $175,000 | None Available | |
| Rademacher Karl D | $110,000 | -- |
Source: Public Records
Mortgage History
| Date | Status | Borrower | Loan Amount |
|---|---|---|---|
| Previous Owner | Carroll Lisa A | $139,920 | |
| Previous Owner | Rademacher Karl D | $104,500 |
Source: Public Records
Tax History
| Year | Tax Paid | Tax Assessment Tax Assessment Total Assessment is a certain percentage of the fair market value that is determined by local assessors to be the total taxable value of land and additions on the property. | Land | Improvement |
|---|---|---|---|---|
| 2025 | $8,243 | $16,000 | $3,120 | $12,880 |
| 2024 | $8,243 | $16,000 | $3,120 | $12,880 |
| 2023 | $8,233 | $16,000 | $3,120 | $12,880 |
| 2022 | $8,233 | $11,262 | $2,730 | $8,532 |
| 2021 | $8,317 | $11,261 | $2,730 | $8,531 |
| 2020 | $7,778 | $11,261 | $2,730 | $8,531 |
| 2019 | $5,860 | $9,955 | $2,535 | $7,420 |
| 2018 | $5,705 | $9,955 | $2,535 | $7,420 |
| 2017 | $5,594 | $9,955 | $2,535 | $7,420 |
| 2016 | $6,527 | $10,394 | $2,340 | $8,054 |
| 2015 | $6,275 | $10,394 | $2,340 | $8,054 |
| 2014 | $6,110 | $10,394 | $2,340 | $8,054 |
| 2013 | $5,691 | $10,785 | $2,340 | $8,445 |
Source: Public Records
Map
Nearby Homes
- 411 Seward St
- 209 Indiana St
- 331 Gentry St
- 332 Gentry St
- 417 New Salem St
- 442 Homan Ave
- 315 Illinois St
- 338 Farragut St
- 126 Indiana St
- 120 Indiana St
- 325 Indiana St
- 3133 Heritage Blvd
- 244 Thomas St
- 212 Berry St
- 21008 Apollo Cir
- 231 Farragut St
- 21617 Dogwood Rd Unit 1125
- 3421 Station Dr
- 21635 Dogwood Rd Unit 1165
- 118 Well St
- 406 Sherman St
- 402 Sherman St
- 409 Illinois St
- 408 Sherman St
- 411 Illinois St
- 407 Illinois St
- 316 Springfield St
- 318 Springfield St
- 407 Sherman St
- 405 Sherman St
- 410 Sherman St
- 409 Sherman St
- 403 Sherman St
- 320 Springfield St
- 411 Sherman St
- 415 Illinois St
- 312 Springfield St
- 412 Sherman St
- 413 Sherman St
- 417 Illinois St
Your Personal Tour Guide
Ask me questions while you tour the home.