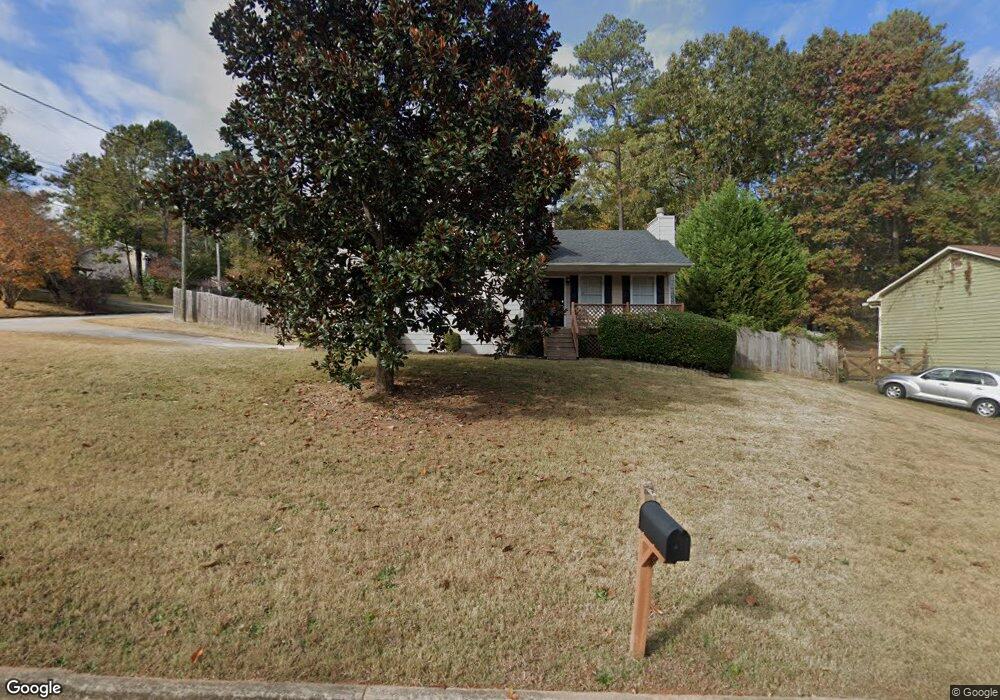
404 Stanton Ridge Way SE Unit 4 Conyers, GA 30094
Estimated Value: $183,000 - $252,000
3
Beds
3
Baths
1,524
Sq Ft
$150/Sq Ft
Est. Value
About This Home
This home is located at 404 Stanton Ridge Way SE Unit 4, Conyers, GA 30094 and is currently estimated at $228,803, approximately $150 per square foot. 404 Stanton Ridge Way SE Unit 4 is a home located in Rockdale County with nearby schools including Sims Elementary School, Edwards Middle School, and Heritage High School.
Ownership History
Date
Name
Owned For
Owner Type
Purchase Details
Closed on
Jan 31, 2014
Sold by
Srp Sub Llc
Bought by
Tarbert Llc and C O Waypoint Homes
Current Estimated Value
Purchase Details
Closed on
Nov 5, 2013
Sold by
Johnson Coliss E
Bought by
Srp Sub Llc
Purchase Details
Closed on
Apr 28, 2000
Sold by
Ring Leon F and Ring Sue C
Bought by
Johnson Corliss E
Home Financials for this Owner
Home Financials are based on the most recent Mortgage that was taken out on this home.
Original Mortgage
$105,000
Interest Rate
8.14%
Mortgage Type
VA
Purchase Details
Closed on
Feb 9, 1998
Sold by
Jones Wilburn D
Bought by
Ring Leon F and Ring Sue Carol
Home Financials for this Owner
Home Financials are based on the most recent Mortgage that was taken out on this home.
Original Mortgage
$81,000
Interest Rate
6.89%
Mortgage Type
New Conventional
Create a Home Valuation Report for This Property
The Home Valuation Report is an in-depth analysis detailing your home's value as well as a comparison with similar homes in the area
Home Values in the Area
Average Home Value in this Area
Purchase History
| Date | Buyer | Sale Price | Title Company |
|---|---|---|---|
| Tarbert Llc | -- | -- | |
| Srp Sub Llc | $60,000 | -- | |
| Johnson Corliss E | $105,000 | -- | |
| Ring Leon F | $78,600 | -- |
Source: Public Records
Mortgage History
| Date | Status | Borrower | Loan Amount |
|---|---|---|---|
| Previous Owner | Johnson Corliss E | $105,000 | |
| Previous Owner | Ring Leon F | $81,000 |
Source: Public Records
Tax History Compared to Growth
Tax History
| Year | Tax Paid | Tax Assessment Tax Assessment Total Assessment is a certain percentage of the fair market value that is determined by local assessors to be the total taxable value of land and additions on the property. | Land | Improvement |
|---|---|---|---|---|
| 2024 | $3,287 | $82,000 | $16,838 | $65,162 |
| 2023 | $3,369 | $82,000 | $16,838 | $65,162 |
| 2022 | $2,883 | $69,760 | $14,520 | $55,240 |
| 2021 | $2,139 | $51,680 | $8,000 | $43,680 |
| 2020 | $1,855 | $43,520 | $6,400 | $37,120 |
| 2019 | $1,936 | $43,120 | $6,000 | $37,120 |
| 2018 | $1,468 | $32,560 | $5,200 | $27,360 |
| 2017 | $1,227 | $26,960 | $4,240 | $22,720 |
| 2016 | $1,227 | $26,960 | $4,240 | $22,720 |
| 2015 | $1,097 | $24,080 | $4,240 | $19,840 |
| 2014 | $1,061 | $23,040 | $3,200 | $19,840 |
| 2013 | -- | $38,200 | $8,760 | $29,440 |
Source: Public Records
Map
Nearby Homes
- 340 Windsor Walk SE
- 2631 Rolling Hills Way SE
- 309 Windsor Walk SE Unit 1
- 1601 Creek Crossing SE
- 1420 Hillside Place SE
- 1508 Hillside Dr SE
- 2370 Ebenezer Rd SE
- Boston Plan at Millers Pointe
- Atlanta Plan at Millers Pointe
- Columbus Plan at Millers Pointe
- 1511 Hillside Dr SE
- 2464 Lennox Rd SE
- 2617 Laurel Woods Ln SE Unit 3
- 2537 Lennox Rd SE
- 250 Smile Dr SE
- 2608 Downing Park Dr SE
- 2717 Stanton Woods Dr SE
- 784 Stieff Ct SE
- 170 Old Mill Trail SW
- 574 Almand Branch Rd SE Unit 1
- 404 Stanton Ridge Way SE
- 408 Stanton Ridge Way SE Unit 4
- 5400 Cindy Ln SE
- 419 Cindy Dr SE
- 412 Stanton Ridge Way SE Unit 4
- 409 Stanton Ridge Way SE Unit 4
- 5402 Cindy Ln SE
- 415 Cindy Dr SE
- 405 Stanton Ridge Way SE
- 413 Stanton Ridge Way SE
- 401 Stanton Ridge Way SE
- 401 Stanton Ridge Way SE
- 401 Stanton Ridge Way SE Unit 2
- 5404 Cindy Ln SE
- 411 Cindy Dr SE
- 411 Cindy Dr SE
- 411 Cindy Dr SE Unit 411
- 416 Stanton Ridge Way SE
- 416 Stanton Ridge Way SE
- 376 Windsor Walk SE