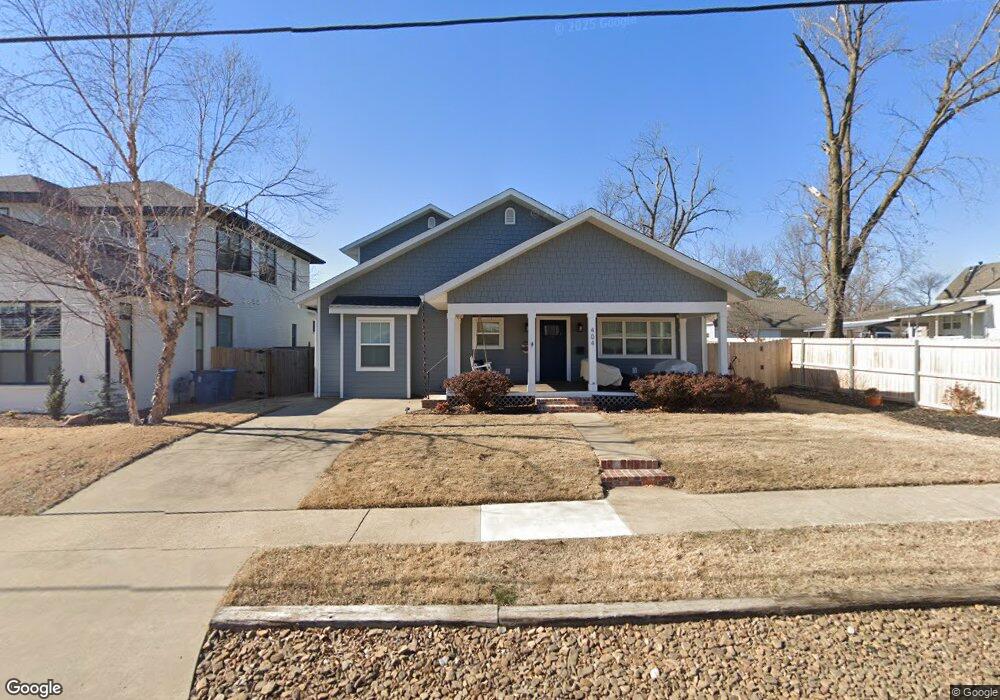
404 SW D St Bentonville, AR 72712
Estimated Value: $690,000 - $1,364,101
3
Beds
2
Baths
1,235
Sq Ft
$921/Sq Ft
Est. Value
About This Home
This home is located at 404 SW D St, Bentonville, AR 72712 and is currently estimated at $1,137,367, approximately $920 per square foot. 404 SW D St is a home located in Benton County with nearby schools including R.E. Baker Elementary School, Old High Middle School, and Washington Junior High School.
Ownership History
Date
Name
Owned For
Owner Type
Purchase Details
Closed on
Dec 19, 2014
Sold by
Frierson Emma
Bought by
Sego Barton T and Sego Gena R
Current Estimated Value
Home Financials for this Owner
Home Financials are based on the most recent Mortgage that was taken out on this home.
Original Mortgage
$120,000
Interest Rate
4.01%
Mortgage Type
Future Advance Clause Open End Mortgage
Purchase Details
Closed on
May 20, 2011
Sold by
Oneal Ferina Dawn and Brown Ferina Dawn
Bought by
Frierson Emma
Home Financials for this Owner
Home Financials are based on the most recent Mortgage that was taken out on this home.
Original Mortgage
$91,709
Interest Rate
4.85%
Mortgage Type
New Conventional
Purchase Details
Closed on
Dec 9, 1998
Bought by
Oneal F
Purchase Details
Closed on
May 8, 1990
Bought by
Oneal
Purchase Details
Closed on
Nov 13, 1989
Bought by
Dod 11-13-1989
Create a Home Valuation Report for This Property
The Home Valuation Report is an in-depth analysis detailing your home's value as well as a comparison with similar homes in the area
Home Values in the Area
Average Home Value in this Area
Purchase History
| Date | Buyer | Sale Price | Title Company |
|---|---|---|---|
| Sego Barton T | $125,000 | First National Title Co | |
| Frierson Emma | $88,000 | None Available | |
| Oneal F | -- | -- | |
| Oneal | $35,000 | -- | |
| Dod 11-13-1989 | -- | -- |
Source: Public Records
Mortgage History
| Date | Status | Borrower | Loan Amount |
|---|---|---|---|
| Closed | Sego Barton T | $120,000 | |
| Previous Owner | Frierson Emma | $91,709 |
Source: Public Records
Tax History Compared to Growth
Tax History
| Year | Tax Paid | Tax Assessment Tax Assessment Total Assessment is a certain percentage of the fair market value that is determined by local assessors to be the total taxable value of land and additions on the property. | Land | Improvement |
|---|---|---|---|---|
| 2025 | $9,621 | $249,885 | $69,369 | $180,516 |
| 2024 | $9,225 | $249,885 | $69,369 | $180,516 |
| 2023 | $8,786 | $142,164 | $63,162 | $79,002 |
| 2022 | $8,624 | $142,164 | $63,162 | $79,002 |
| 2021 | $2,098 | $90,970 | $63,160 | $27,810 |
| 2020 | $1,982 | $54,450 | $39,200 | $15,250 |
| 2019 | $1,906 | $54,450 | $39,200 | $15,250 |
| 2018 | $1,855 | $54,450 | $39,200 | $15,250 |
| 2017 | $1,201 | $50,220 | $40,770 | $9,450 |
| 2016 | $1,201 | $50,220 | $40,770 | $9,450 |
| 2015 | $1,475 | $23,860 | $4,000 | $19,860 |
| 2014 | $1,125 | $23,860 | $4,000 | $19,860 |
Source: Public Records
Map
Nearby Homes