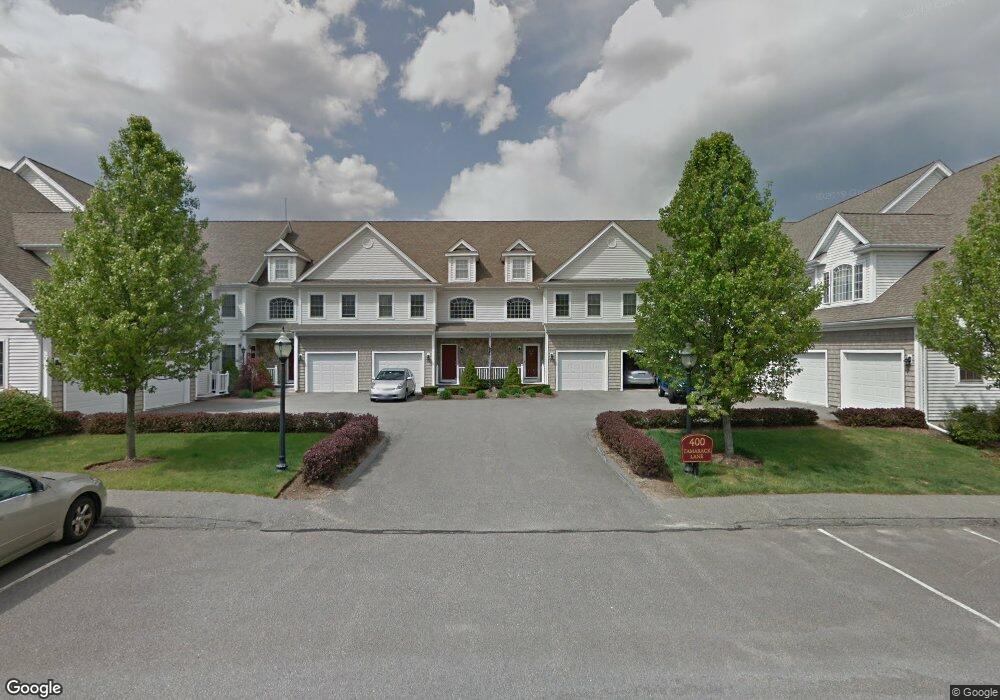
404 Tamarack Ln Abington, MA 02351
Estimated Value: $473,000 - $490,000
2
Beds
2
Baths
1,495
Sq Ft
$320/Sq Ft
Est. Value
About This Home
This home is located at 404 Tamarack Ln, Abington, MA 02351 and is currently estimated at $478,161, approximately $319 per square foot. 404 Tamarack Ln is a home located in Plymouth County with nearby schools including Woodsdale School, Beaver Brook Elementary School, and Abington Middle School.
Ownership History
Date
Name
Owned For
Owner Type
Purchase Details
Closed on
Aug 14, 2015
Sold by
Mcdonough Karen M
Bought by
Histen 3Rd Albert F and Histen Caroline
Current Estimated Value
Home Financials for this Owner
Home Financials are based on the most recent Mortgage that was taken out on this home.
Original Mortgage
$220,000
Outstanding Balance
$173,322
Interest Rate
4.08%
Mortgage Type
New Conventional
Estimated Equity
$304,839
Purchase Details
Closed on
Aug 1, 2013
Sold by
Freiwald Jeffrey R
Bought by
Mcdonough Karen M
Home Financials for this Owner
Home Financials are based on the most recent Mortgage that was taken out on this home.
Original Mortgage
$199,120
Interest Rate
3.95%
Mortgage Type
New Conventional
Purchase Details
Closed on
Jun 28, 2007
Sold by
Gables Development Cor
Bought by
Freiwald Jeffrey R
Create a Home Valuation Report for This Property
The Home Valuation Report is an in-depth analysis detailing your home's value as well as a comparison with similar homes in the area
Home Values in the Area
Average Home Value in this Area
Purchase History
| Date | Buyer | Sale Price | Title Company |
|---|---|---|---|
| Histen 3Rd Albert F | $277,000 | -- | |
| Mcdonough Karen M | $248,900 | -- | |
| Freiwald Jeffrey R | $271,400 | -- | |
| Freiwald Jeffrey R | $271,400 | -- |
Source: Public Records
Mortgage History
| Date | Status | Borrower | Loan Amount |
|---|---|---|---|
| Open | Histen 3Rd Albert F | $220,000 | |
| Closed | Histen 3Rd Albert F | $220,000 | |
| Previous Owner | Mcdonough Karen M | $199,120 |
Source: Public Records
Tax History Compared to Growth
Tax History
| Year | Tax Paid | Tax Assessment Tax Assessment Total Assessment is a certain percentage of the fair market value that is determined by local assessors to be the total taxable value of land and additions on the property. | Land | Improvement |
|---|---|---|---|---|
| 2025 | $5,191 | $397,500 | $0 | $397,500 |
| 2024 | $4,822 | $360,400 | $0 | $360,400 |
| 2023 | $4,824 | $339,500 | $0 | $339,500 |
| 2022 | $4,692 | $308,300 | $0 | $308,300 |
| 2021 | $4,623 | $280,500 | $0 | $280,500 |
| 2020 | $4,323 | $254,300 | $0 | $254,300 |
| 2019 | $4,269 | $245,500 | $0 | $245,500 |
| 2018 | $4,255 | $238,800 | $0 | $238,800 |
| 2017 | $4,175 | $227,500 | $0 | $227,500 |
| 2016 | $3,923 | $218,800 | $0 | $218,800 |
| 2015 | $3,842 | $226,000 | $0 | $226,000 |
Source: Public Records
Map
Nearby Homes
- 305 Rembrandt Way Unit 305
- 717 Hampton Way
- 101 Regency Ln
- 307 Regency Ln Unit 307
- 21 Maplewood Cir
- 190 Kevin Rd
- 18 Brookfield Dr
- 261 Jon Dr
- 285 Hovendon Ave
- 298 N Quincy St
- 89 Dixon Rd
- 176 Coe Rd
- 53 Kent St
- 61 Kent St
- 97 Waleco Rd
- 22 Blossom St
- 187 Arthur St
- 79 Nicholson Dr
- 95 Nicholson Dr
- 175 Winter St
- 422 Tamarack Ln
- 420 Tamarack Ln
- 418 Tamarack Ln
- 416 Tamarack Ln
- 414 Tamarack Ln
- 418 Tamarack Ln Unit 418
- 408 Tamarack Ln Unit 408
- 422 Tamarack Ln Unit 400
- 404 Tamarack Ln Unit 400
- 418 Tamarack Ln Unit 400
- 408 Tamarack Ln Unit 400
- 424 Tamarack Ln
- 412 Tamarack Ln
- 410 Tamarack Ln
- 406 Tamarack Ln
- 406 Tamarack Ln Unit 406
- 410 Tamarack Ln Unit 410
- 412 Tamarack Ln Unit 412
- 101 Rembrandt Way
- 101 Rembrandt Way Unit 101