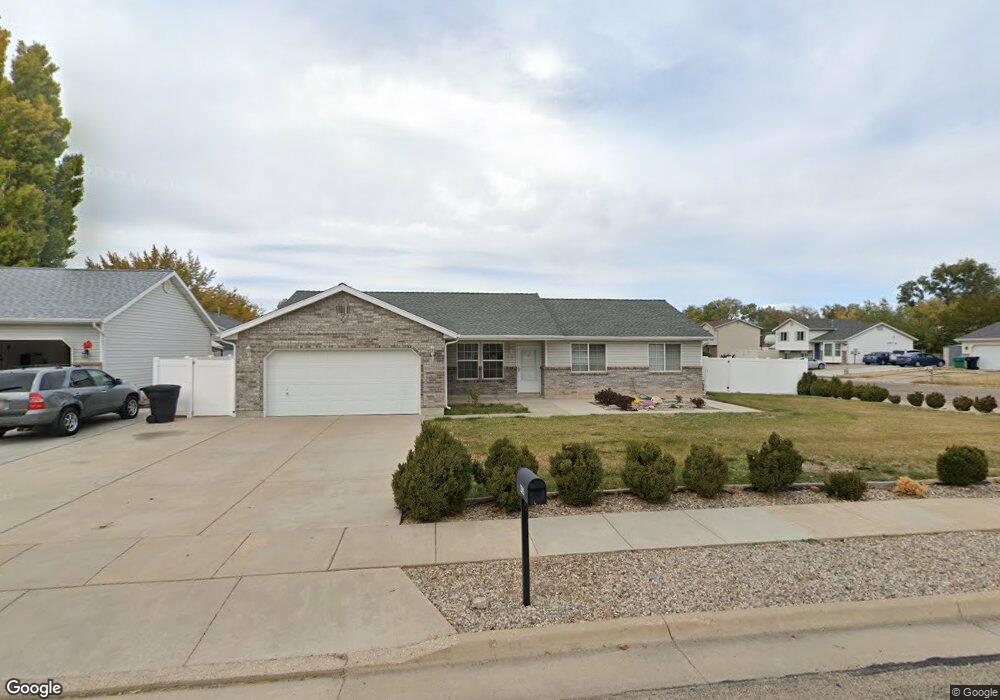
404 W 325 N Clearfield, UT 84015
Estimated Value: $390,000 - $432,000
3
Beds
2
Baths
1,337
Sq Ft
$310/Sq Ft
Est. Value
About This Home
This home is located at 404 W 325 N, Clearfield, UT 84015 and is currently estimated at $415,115, approximately $310 per square foot. 404 W 325 N is a home located in Davis County with nearby schools including Holt Elementary School, North Davis Junior High School, and Clearfield High School.
Ownership History
Date
Name
Owned For
Owner Type
Purchase Details
Closed on
Sep 15, 2003
Sold by
Hud
Bought by
Carmichael Chong Hui
Current Estimated Value
Home Financials for this Owner
Home Financials are based on the most recent Mortgage that was taken out on this home.
Original Mortgage
$83,200
Outstanding Balance
$37,809
Interest Rate
6.06%
Mortgage Type
Purchase Money Mortgage
Estimated Equity
$377,307
Purchase Details
Closed on
Jul 9, 2003
Sold by
Citimortgage Inc
Bought by
Hud
Purchase Details
Closed on
Apr 23, 2003
Sold by
Hebdon Karen
Bought by
Citimortgage Inc
Purchase Details
Closed on
Mar 22, 1999
Sold by
Mark Higley Construction Lc
Bought by
Hebdon Karen
Home Financials for this Owner
Home Financials are based on the most recent Mortgage that was taken out on this home.
Original Mortgage
$121,002
Interest Rate
6.73%
Mortgage Type
FHA
Purchase Details
Closed on
May 6, 1998
Sold by
Wasatch West Lc
Bought by
Mark Higley Construction Lc
Create a Home Valuation Report for This Property
The Home Valuation Report is an in-depth analysis detailing your home's value as well as a comparison with similar homes in the area
Home Values in the Area
Average Home Value in this Area
Purchase History
| Date | Buyer | Sale Price | Title Company |
|---|---|---|---|
| Carmichael Chong Hui | -- | Us Title | |
| Hud | -- | First American Title Co | |
| Citimortgage Inc | $127,089 | First American Title Co | |
| Hebdon Karen | -- | First American Title Co | |
| Mark Higley Construction Lc | -- | Founders Title Co |
Source: Public Records
Mortgage History
| Date | Status | Borrower | Loan Amount |
|---|---|---|---|
| Open | Carmichael Chong Hui | $83,200 | |
| Previous Owner | Hebdon Karen | $121,002 |
Source: Public Records
Tax History
| Year | Tax Paid | Tax Assessment Tax Assessment Total Assessment is a certain percentage of the fair market value that is determined by local assessors to be the total taxable value of land and additions on the property. | Land | Improvement |
|---|---|---|---|---|
| 2025 | $2,314 | $207,350 | $75,525 | $131,825 |
| 2024 | $2,230 | $201,299 | $72,153 | $129,146 |
| 2023 | $2,064 | $188,100 | $63,116 | $124,983 |
| 2022 | $2,216 | $361,000 | $118,261 | $242,739 |
| 2021 | $2,031 | $275,000 | $72,791 | $202,209 |
| 2020 | $1,755 | $236,000 | $61,911 | $174,089 |
| 2019 | $1,695 | $225,000 | $62,355 | $162,645 |
| 2018 | $1,539 | $199,000 | $55,346 | $143,654 |
| 2016 | $1,401 | $94,710 | $22,350 | $72,360 |
| 2015 | $1,316 | $84,810 | $22,350 | $62,460 |
| 2014 | $1,371 | $89,569 | $22,350 | $67,219 |
| 2013 | -- | $82,454 | $30,451 | $52,003 |
Source: Public Records
Map
Nearby Homes
- 482 Vickie Ln
- 482 W 275 N
- 463 N 200 W
- 499 W 180 N
- 478 W 180 N
- 47 Villa Dr
- 156 W 300 N
- 137 W 250 N
- 62 Villa Dr
- 75 W 250 N Unit 78
- 75 W 250 N Unit 31
- 75 W 250 N Unit 110
- 75 W 250 N Unit 56
- 75 W 250 N Unit 84
- 75 W 250 N Unit 13
- 75 W 250 N Unit 12
- 54 W 250 N
- 777 W 300 N
- 285 N Main St Unit 308
- 151 W 700 N
Your Personal Tour Guide
Ask me questions while you tour the home.