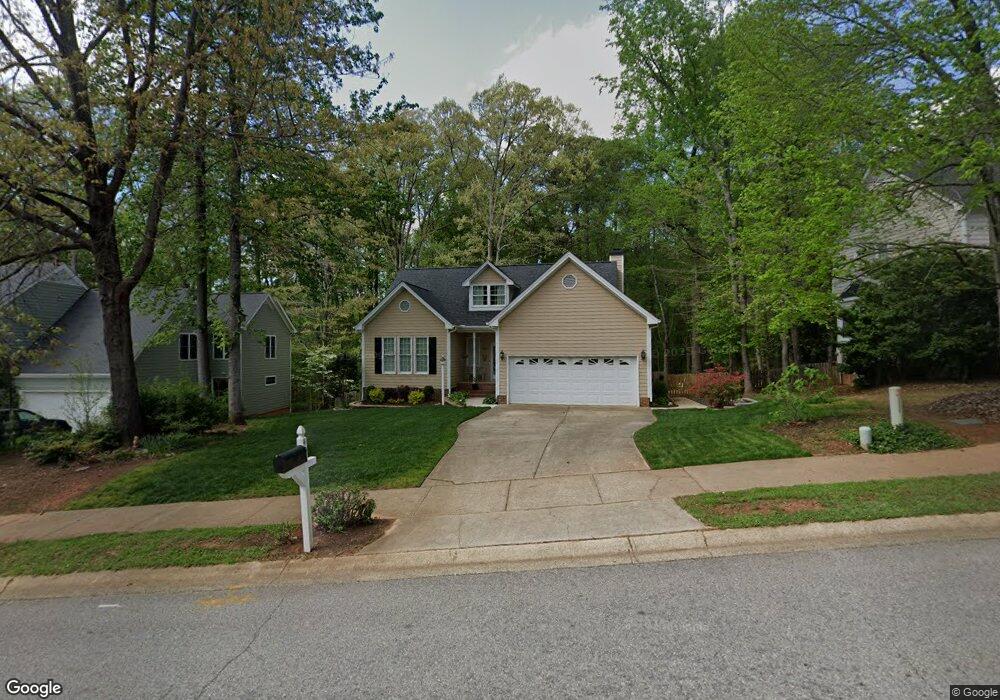
404 W Ballentine St Holly Springs, NC 27540
Estimated Value: $454,000 - $483,000
3
Beds
2
Baths
2,135
Sq Ft
$221/Sq Ft
Est. Value
About This Home
This home is located at 404 W Ballentine St, Holly Springs, NC 27540 and is currently estimated at $470,888, approximately $220 per square foot. 404 W Ballentine St is a home located in Wake County with nearby schools including Oakview Elementary School, Apex Friendship Middle School, and Holly Springs High School.
Ownership History
Date
Name
Owned For
Owner Type
Purchase Details
Closed on
Jun 26, 2006
Sold by
Parker Heath C and Parker Thaddeus
Bought by
Hansen Melody M
Current Estimated Value
Home Financials for this Owner
Home Financials are based on the most recent Mortgage that was taken out on this home.
Original Mortgage
$204,800
Outstanding Balance
$111,945
Interest Rate
5.25%
Mortgage Type
Purchase Money Mortgage
Estimated Equity
$358,943
Purchase Details
Closed on
Jan 31, 2002
Sold by
Wilkerson Glen W and Wilkerson Shawn W
Bought by
Dalton Heath C
Home Financials for this Owner
Home Financials are based on the most recent Mortgage that was taken out on this home.
Original Mortgage
$132,800
Interest Rate
7.14%
Purchase Details
Closed on
May 8, 1998
Sold by
Heath Ronald E
Bought by
Wilkerson Glen W and Wilkerson Shawn W
Home Financials for this Owner
Home Financials are based on the most recent Mortgage that was taken out on this home.
Original Mortgage
$152,050
Interest Rate
7.03%
Mortgage Type
FHA
Create a Home Valuation Report for This Property
The Home Valuation Report is an in-depth analysis detailing your home's value as well as a comparison with similar homes in the area
Home Values in the Area
Average Home Value in this Area
Purchase History
| Date | Buyer | Sale Price | Title Company |
|---|---|---|---|
| Hansen Melody M | $228,000 | None Available | |
| Dalton Heath C | $166,000 | -- | |
| Wilkerson Glen W | $155,000 | -- |
Source: Public Records
Mortgage History
| Date | Status | Borrower | Loan Amount |
|---|---|---|---|
| Open | Hansen Melody M | $204,800 | |
| Previous Owner | Dalton Heath C | $132,800 | |
| Previous Owner | Wilkerson Glen W | $152,050 | |
| Closed | Dalton Heath C | $16,600 |
Source: Public Records
Tax History Compared to Growth
Tax History
| Year | Tax Paid | Tax Assessment Tax Assessment Total Assessment is a certain percentage of the fair market value that is determined by local assessors to be the total taxable value of land and additions on the property. | Land | Improvement |
|---|---|---|---|---|
| 2025 | $3,748 | $433,137 | $120,000 | $313,137 |
| 2024 | $3,732 | $433,137 | $120,000 | $313,137 |
| 2023 | $3,107 | $286,242 | $75,000 | $211,242 |
| 2022 | $3,000 | $286,242 | $75,000 | $211,242 |
| 2021 | $2,944 | $286,242 | $75,000 | $211,242 |
| 2020 | $2,944 | $286,242 | $75,000 | $211,242 |
| 2019 | $2,510 | $206,973 | $55,000 | $151,973 |
| 2018 | $2,270 | $206,973 | $55,000 | $151,973 |
| 2017 | $2,188 | $206,973 | $55,000 | $151,973 |
| 2016 | $2,158 | $206,973 | $55,000 | $151,973 |
| 2015 | $2,416 | $228,338 | $46,000 | $182,338 |
| 2014 | $2,333 | $228,338 | $46,000 | $182,338 |
Source: Public Records
Map
Nearby Homes
- 405 W Ballentine St
- 321 Cross Hill Ln
- 105 Cross Hill Ln
- 104 Chilmark Ridge Dr
- 220 Avent Ferry Rd
- 112 Burt St
- 124 Cliffdale Rd
- 225 Douglas St
- 401 Vista Springs Cir
- 224 Hartshorn Ct
- 321 Blalock St
- 318 Blalock St
- 421 Grigsby Ave
- 126 Tuska Hills Dr
- 717 Utley St
- 108 Crabwall Ct
- 209 W Maple Ave
- 737 W Holly Springs Rd
- 743 W Holly Springs Rd
- 749 W Holly Springs Rd
- 400 W Ballentine St
- 408 W Ballentine St
- 412 W Ballentine St
- 401 W Ballentine St
- 409 W Ballentine St
- 416 W Ballentine St
- 413 W Ballentine St
- 420 W Ballentine St
- 417 W Ballentine St
- 109 Dutch Hill Rd
- 105 Dutch Hill Rd
- 113 Dutch Hill Rd
- 408 W Elm Ave
- 101 Dutch Hill Rd
- 117 Dutch Hill Rd
- 404 W Elm Ave
- 409 W Elm Ave
- 308 Ash Ct
- 121 Dutch Hill Rd
- 400 W Elm Ave