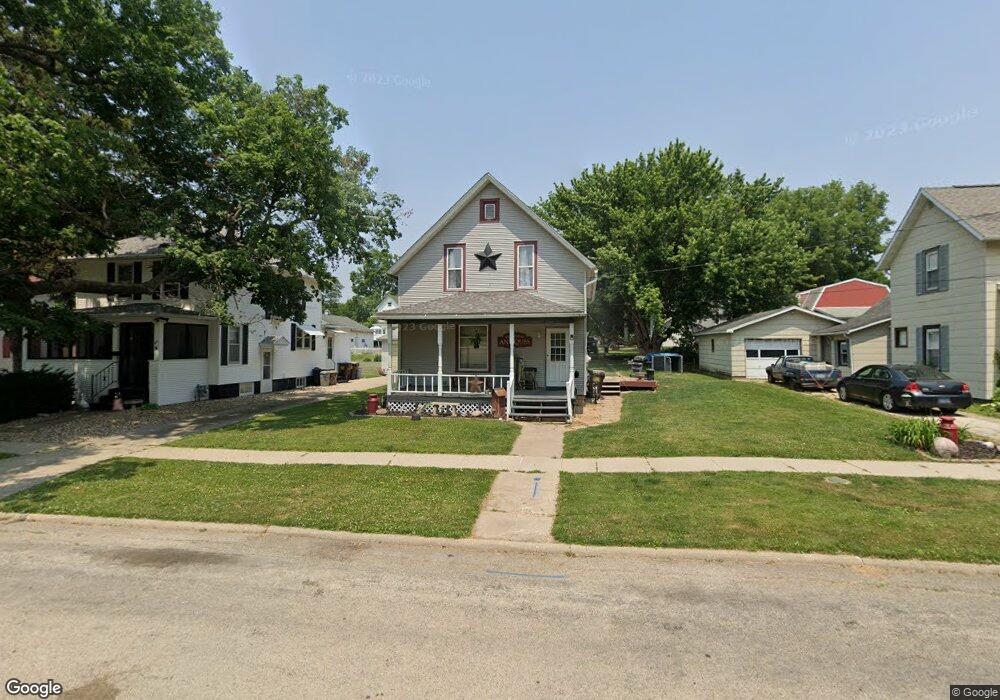
404 W Morris St Morrison, IL 61270
Estimated Value: $102,968 - $129,000
2
Beds
--
Bath
1,390
Sq Ft
$83/Sq Ft
Est. Value
About This Home
This home is located at 404 W Morris St, Morrison, IL 61270 and is currently estimated at $115,992, approximately $83 per square foot. 404 W Morris St is a home located in Whiteside County with nearby schools including Northside School, Southside School, and Morrison Junior High School.
Ownership History
Date
Name
Owned For
Owner Type
Purchase Details
Closed on
Apr 29, 2009
Sold by
Wagner Jeremy S and Wagner Andrea M
Bought by
Given Shanna
Current Estimated Value
Home Financials for this Owner
Home Financials are based on the most recent Mortgage that was taken out on this home.
Original Mortgage
$72,800
Outstanding Balance
$46,490
Interest Rate
5.05%
Mortgage Type
New Conventional
Estimated Equity
$69,502
Purchase Details
Closed on
Jan 13, 2009
Sold by
Vanderleest Cynthia R and Houzenga Cynthia R
Bought by
Wagner Jeremy S and Wagner Andrea M
Home Financials for this Owner
Home Financials are based on the most recent Mortgage that was taken out on this home.
Original Mortgage
$57,995
Interest Rate
5.53%
Mortgage Type
Future Advance Clause Open End Mortgage
Purchase Details
Closed on
Dec 29, 2005
Sold by
Proud Gregory S and Proud Christine G
Bought by
Houzenga Cynthia R
Home Financials for this Owner
Home Financials are based on the most recent Mortgage that was taken out on this home.
Original Mortgage
$59,850
Interest Rate
6.34%
Mortgage Type
New Conventional
Create a Home Valuation Report for This Property
The Home Valuation Report is an in-depth analysis detailing your home's value as well as a comparison with similar homes in the area
Home Values in the Area
Average Home Value in this Area
Purchase History
| Date | Buyer | Sale Price | Title Company |
|---|---|---|---|
| Given Shanna | $70,000 | None Available | |
| Wagner Jeremy S | $63,000 | None Available | |
| Houzenga Cynthia R | $63,000 | None Available |
Source: Public Records
Mortgage History
| Date | Status | Borrower | Loan Amount |
|---|---|---|---|
| Open | Given Shanna | $72,800 | |
| Previous Owner | Wagner Jeremy S | $57,995 | |
| Previous Owner | Houzenga Cynthia R | $59,850 |
Source: Public Records
Tax History
| Year | Tax Paid | Tax Assessment Tax Assessment Total Assessment is a certain percentage of the fair market value that is determined by local assessors to be the total taxable value of land and additions on the property. | Land | Improvement |
|---|---|---|---|---|
| 2024 | $1,914 | $29,467 | $2,261 | $27,206 |
| 2023 | $1,739 | $26,827 | $2,058 | $24,769 |
| 2022 | $1,598 | $24,913 | $1,911 | $23,002 |
| 2021 | $1,546 | $24,395 | $1,871 | $22,524 |
| 2020 | $1,584 | $24,857 | $1,906 | $22,951 |
| 2019 | $1,641 | $25,339 | $1,575 | $23,764 |
| 2018 | $1,702 | $25,226 | $1,568 | $23,658 |
| 2017 | $1,561 | $24,232 | $1,506 | $22,726 |
| 2016 | $1,481 | $23,372 | $1,453 | $21,919 |
| 2015 | $1,086 | $18,449 | $1,488 | $16,961 |
| 2014 | $1,073 | $18,240 | $1,471 | $16,769 |
| 2013 | $1,086 | $18,449 | $1,488 | $16,961 |
Source: Public Records
Map
Nearby Homes
- 411 W Park St
- 402 W Lincolnway
- 617 W Lincolnway
- 301 S Genesee St
- 308 S Genesee St
- 109 E Morris St
- 105 E Knox St
- 604 Hillandale Ct
- 814 W Park St
- 301 E Wall St
- 302 E Park St
- 509 S Madison St
- 208 Johnson St
- 400 E Knox St
- 503 Portland Ave
- 403 E Park St
- 503 E Main St
- 418 E Wall St
- 513 E Main St
- 101 N Jackson St
- 404 W Morris St
- 406 W Morris St
- 402 W Morris St
- 205 S Grape St
- 410 W Morris St
- 209 S Grape St
- 409 W Wall St
- 405 W Wall St
- 411 W Wall St
- 405 W Morris St
- 409 W Morris St
- 407 W Morris St
- 209 S Hall St
- 308 W Morris St
- 201 S Grape St
- 502 W Morris St
- 302 S Hall St
- 203 S Hall St
- 204 S Grape St
- 501 W Morris St
Your Personal Tour Guide
Ask me questions while you tour the home.