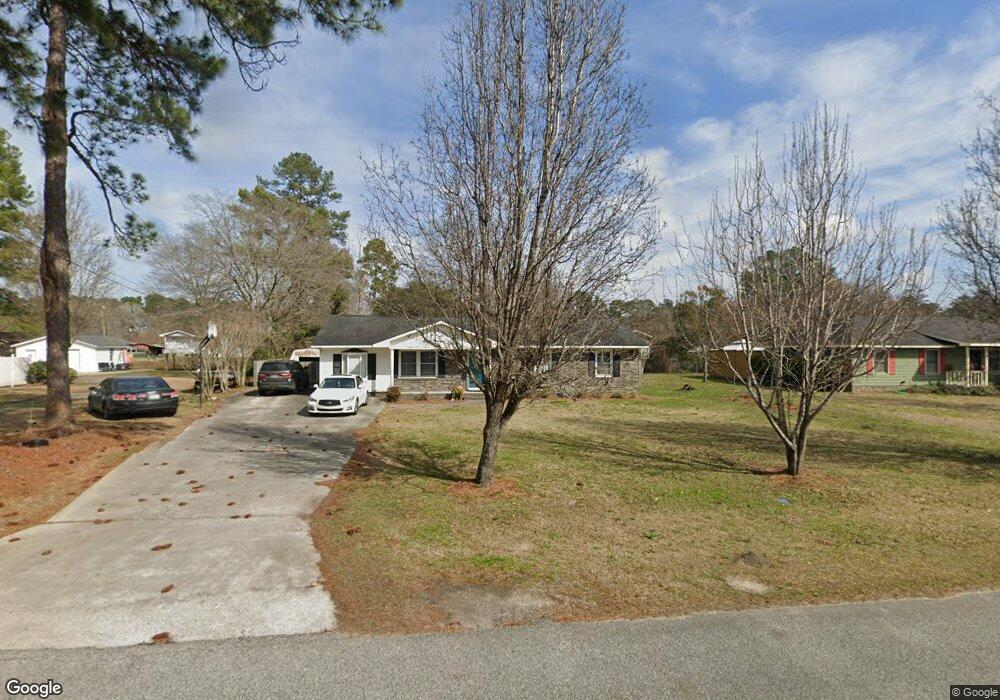
404 W Myrtle Rd Andrews, SC 29510
Estimated Value: $139,000 - $222,000
3
Beds
2
Baths
1,350
Sq Ft
$131/Sq Ft
Est. Value
About This Home
This home is located at 404 W Myrtle Rd, Andrews, SC 29510 and is currently estimated at $177,176, approximately $131 per square foot. 404 W Myrtle Rd is a home located in Georgetown County with nearby schools including Andrews Elementary School, Rosemary Middle School, and Andrews High School.
Ownership History
Date
Name
Owned For
Owner Type
Purchase Details
Closed on
Jun 23, 2020
Sold by
Ray Carl M
Bought by
Ray Christopher B
Current Estimated Value
Home Financials for this Owner
Home Financials are based on the most recent Mortgage that was taken out on this home.
Original Mortgage
$93,279
Outstanding Balance
$82,685
Interest Rate
3.2%
Mortgage Type
FHA
Estimated Equity
$94,491
Purchase Details
Closed on
Apr 3, 2012
Sold by
Ward Homer
Bought by
Ray Carl M
Purchase Details
Closed on
Dec 3, 2010
Sold by
Wells Fargo Bank N A
Bought by
Ward Homer
Purchase Details
Closed on
Nov 16, 2010
Sold by
Walters Jayson and Walters Nicole
Bought by
Wells Fargo Bank N A
Purchase Details
Closed on
Mar 8, 2007
Sold by
Barrineau Laurice Rogerson and Barrineau Shana M
Bought by
Walters Jayson and Walters Nicole
Home Financials for this Owner
Home Financials are based on the most recent Mortgage that was taken out on this home.
Original Mortgage
$111,150
Interest Rate
6.22%
Mortgage Type
Purchase Money Mortgage
Create a Home Valuation Report for This Property
The Home Valuation Report is an in-depth analysis detailing your home's value as well as a comparison with similar homes in the area
Home Values in the Area
Average Home Value in this Area
Purchase History
| Date | Buyer | Sale Price | Title Company |
|---|---|---|---|
| Ray Christopher B | $95,000 | None Available | |
| Ray Carl M | $60,000 | -- | |
| Ward Homer | $49,900 | -- | |
| Wells Fargo Bank N A | $500 | -- | |
| Walters Jayson | $117,000 | None Available |
Source: Public Records
Mortgage History
| Date | Status | Borrower | Loan Amount |
|---|---|---|---|
| Open | Ray Christopher B | $93,279 | |
| Previous Owner | Walters Jayson | $111,150 |
Source: Public Records
Tax History Compared to Growth
Tax History
| Year | Tax Paid | Tax Assessment Tax Assessment Total Assessment is a certain percentage of the fair market value that is determined by local assessors to be the total taxable value of land and additions on the property. | Land | Improvement |
|---|---|---|---|---|
| 2024 | $999 | $3,860 | $250 | $3,610 |
| 2023 | $999 | $3,860 | $250 | $3,610 |
| 2022 | $946 | $3,860 | $250 | $3,610 |
| 2021 | $2,044 | $5,784 | $372 | $5,412 |
| 2020 | $1,517 | $3,856 | $248 | $3,608 |
| 2019 | $1,323 | $0 | $0 | $0 |
| 2018 | $1,349 | $0 | $0 | $0 |
| 2017 | $1,229 | $0 | $0 | $0 |
| 2016 | $1,226 | $3,708 | $0 | $0 |
| 2015 | $1,180 | $0 | $0 | $0 |
| 2014 | $1,180 | $59,600 | $6,200 | $53,400 |
| 2012 | -- | $81,700 | $6,200 | $75,500 |
Source: Public Records
Map
Nearby Homes
- 512 S Hazel Ave
- 40 W Balsam St
- 96 Smokethorn St
- 406 S Rosemary Ave
- 301 S Morgan Ave
- 109 S Maple Ave
- 402 S Magnolia Ave
- 7 Orange Blossom St
- 2 Lots - TBD S Rosemary Ave
- TBD S Rosemary Ave Unit lot 9
- TBD S Rosemary Ave Unit lot 8
- 304 S Magnolia Ave
- 112 S Rosemary Ave
- 15 Mango St
- 208 W Main St
- 106 Jessamine St
- 6 S Rosemary Ave
- 128 Highway 521
- 5 S Rosemary Ave
- 78 Joys Place
- 402 W Myrtle Rd
- 615 S Cedar Ave
- 802 S Cedar Ave
- 608 S Cedar Ave
- 615 S Hazel Ave
- 611 S Cedar Ave
- 805 S Cedar Ave
- 609 S Cedar Ave
- 814 S Cedar Ave
- 814 S Cedar Ave
- W W Myrtle Rd
- 604 S Cedar Ave
- 604 S Cedar Ave
- 809 S Cedar Ave
- 809 S Cedar Ave
- 809 S Cedar Ave
- 611 S Hazel Ave
- 613 S Hazel Ave
- 702 S Poplar Ave
- 610 S Poplar Ave