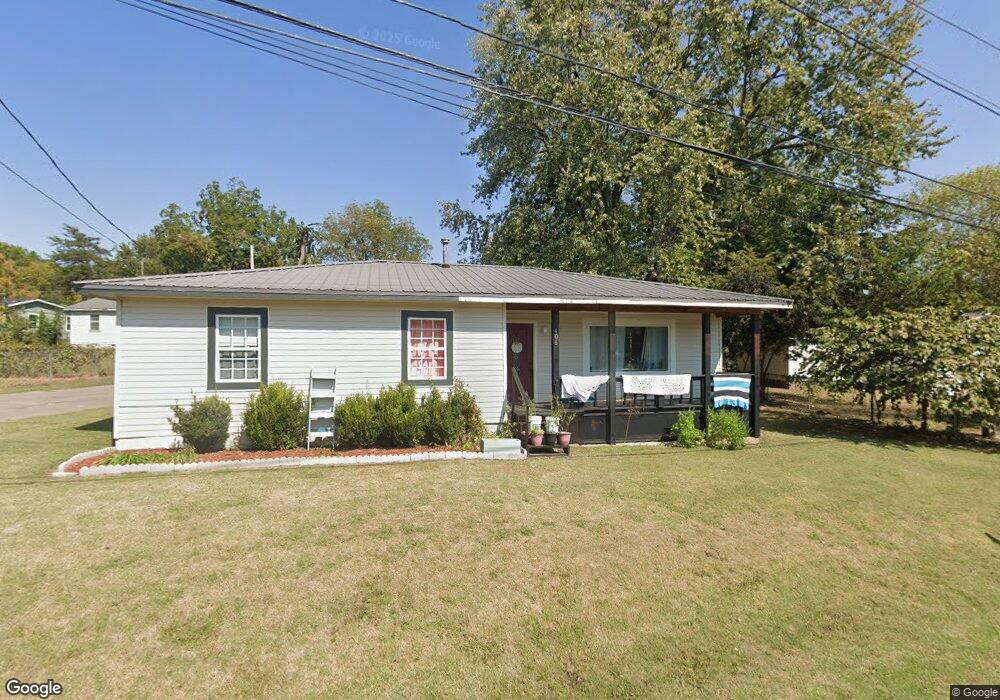
404 W South St Tahlequah, OK 74464
Estimated Value: $145,480 - $178,000
3
Beds
1
Bath
1,270
Sq Ft
$130/Sq Ft
Est. Value
About This Home
This home is located at 404 W South St, Tahlequah, OK 74464 and is currently estimated at $165,370, approximately $130 per square foot. 404 W South St is a home located in Cherokee County with nearby schools including Greenwood Elementary School, Cherokee Elementary School, and Tahlequah Middle School.
Ownership History
Date
Name
Owned For
Owner Type
Purchase Details
Closed on
Oct 24, 2014
Sold by
Curtsinger Mark
Bought by
Tehee Robert A and Tehee Angel R
Current Estimated Value
Home Financials for this Owner
Home Financials are based on the most recent Mortgage that was taken out on this home.
Original Mortgage
$89,195
Outstanding Balance
$68,532
Interest Rate
4.16%
Mortgage Type
New Conventional
Estimated Equity
$96,838
Purchase Details
Closed on
Jul 11, 2013
Sold by
Burchett Billy Gene and Burchett Bill Gene
Bought by
Us Bank Na and Bank Of America Na
Purchase Details
Closed on
Jun 3, 2005
Sold by
Burchett Billy Gene and Burchett Norma
Bought by
Burchett Billy Gene and Burchett Norma
Home Financials for this Owner
Home Financials are based on the most recent Mortgage that was taken out on this home.
Original Mortgage
$67,150
Interest Rate
5.79%
Mortgage Type
New Conventional
Create a Home Valuation Report for This Property
The Home Valuation Report is an in-depth analysis detailing your home's value as well as a comparison with similar homes in the area
Home Values in the Area
Average Home Value in this Area
Purchase History
| Date | Buyer | Sale Price | Title Company |
|---|---|---|---|
| Tehee Robert A | $90,000 | Tahlequah Abstract & Title C | |
| Us Bank Na | $65,862 | None Available | |
| Burchett Billy Gene | -- | Real Estate Closing Company |
Source: Public Records
Mortgage History
| Date | Status | Borrower | Loan Amount |
|---|---|---|---|
| Open | Tehee Robert A | $89,195 | |
| Previous Owner | Burchett Billy Gene | $67,150 |
Source: Public Records
Tax History Compared to Growth
Tax History
| Year | Tax Paid | Tax Assessment Tax Assessment Total Assessment is a certain percentage of the fair market value that is determined by local assessors to be the total taxable value of land and additions on the property. | Land | Improvement |
|---|---|---|---|---|
| 2025 | $575 | $5,828 | $414 | $5,414 |
| 2024 | $575 | $6,069 | $414 | $5,655 |
| 2023 | $575 | $11,951 | $552 | $11,399 |
| 2022 | $1,109 | $11,951 | $552 | $11,399 |
| 2021 | $1,112 | $11,941 | $552 | $11,389 |
| 2020 | $1,078 | $11,372 | $552 | $10,820 |
| 2019 | $1,018 | $10,830 | $552 | $10,278 |
| 2018 | $981 | $10,315 | $552 | $9,763 |
| 2017 | $939 | $9,900 | $552 | $9,348 |
| 2016 | $945 | $9,900 | $552 | $9,348 |
| 2015 | $255 | $9,900 | $552 | $9,348 |
| 2014 | $255 | $2,706 | $335 | $2,371 |
Source: Public Records
Map
Nearby Homes
- 513 S State Ave
- 516 W Fox St
- 510 S Cherokee Ave
- 802 S College Ave
- 528 S Muskogee Ave
- 902 S Mission Ave
- 821 S College Ave
- 905 Shelley Cir
- 224 W Chickasaw St
- 509 W 2nd St
- 757 S Bluff Ave
- 0 W Choctaw St
- 306 Short St
- 1025 W Fox St
- 807 W Choctaw St
- 201 Sandy Cir
- 515 W Delaware St
- 1107 Hillcrest Ave
- 610 W Delaware St
- 1104 Chase Ave