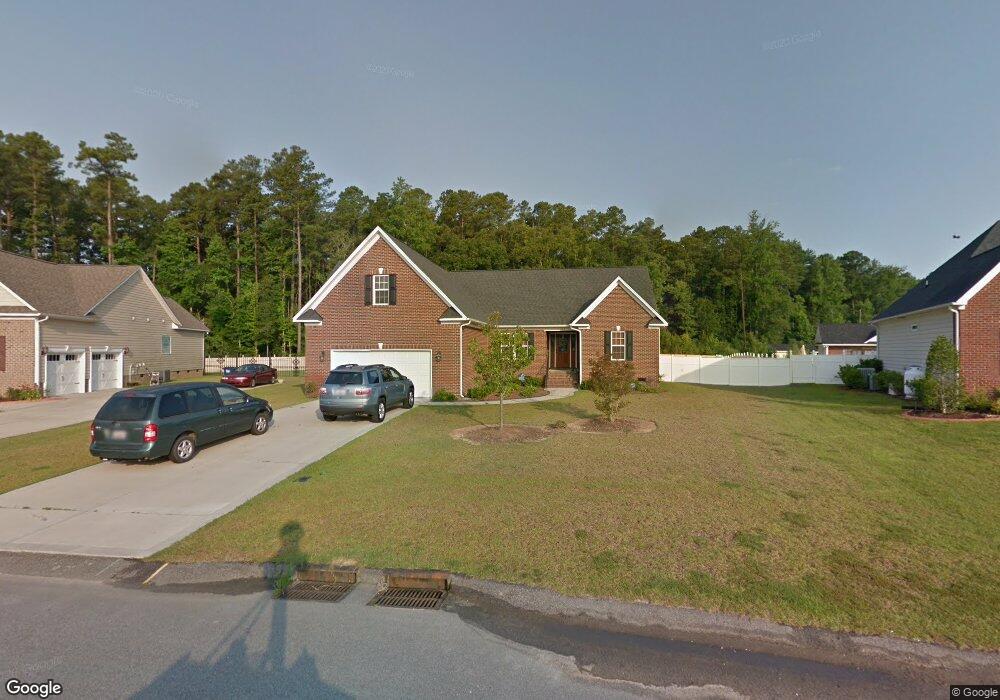
404 Windover (L510) Dr Raeford, NC 28376
Estimated Value: $338,483 - $354,000
3
Beds
3
Baths
2,200
Sq Ft
$157/Sq Ft
Est. Value
About This Home
This home is located at 404 Windover (L510) Dr, Raeford, NC 28376 and is currently estimated at $345,621, approximately $157 per square foot. 404 Windover (L510) Dr is a home located in Hoke County with nearby schools including Rockfish Hoke Elementary School, East Hoke Middle, and Hoke County High.
Ownership History
Date
Name
Owned For
Owner Type
Purchase Details
Closed on
Jul 20, 2020
Sold by
Davis Gino Cottrell
Bought by
Trinidad Jose Alberto Odi and Trinidad Lindsay J
Current Estimated Value
Home Financials for this Owner
Home Financials are based on the most recent Mortgage that was taken out on this home.
Original Mortgage
$219,393
Outstanding Balance
$194,475
Interest Rate
3.2%
Mortgage Type
New Conventional
Estimated Equity
$151,146
Purchase Details
Closed on
Apr 11, 2008
Sold by
Caviness & Cates Building And Developmen
Bought by
Davis Gino Cottrell
Home Financials for this Owner
Home Financials are based on the most recent Mortgage that was taken out on this home.
Original Mortgage
$231,369
Interest Rate
6.22%
Mortgage Type
VA
Purchase Details
Closed on
Dec 20, 2007
Sold by
Westgate Of Hoke Llc
Bought by
Caviness & Cates Building And Developmen
Create a Home Valuation Report for This Property
The Home Valuation Report is an in-depth analysis detailing your home's value as well as a comparison with similar homes in the area
Home Values in the Area
Average Home Value in this Area
Purchase History
| Date | Buyer | Sale Price | Title Company |
|---|---|---|---|
| Trinidad Jose Alberto Odi | $246,000 | None Available | |
| Davis Gino Cottrell | $226,500 | None Available | |
| Caviness & Cates Building And Developmen | $34,500 | None Available |
Source: Public Records
Mortgage History
| Date | Status | Borrower | Loan Amount |
|---|---|---|---|
| Open | Trinidad Jose Alberto Odi | $219,393 | |
| Previous Owner | Davis Gino Cottrell | $231,369 |
Source: Public Records
Tax History Compared to Growth
Tax History
| Year | Tax Paid | Tax Assessment Tax Assessment Total Assessment is a certain percentage of the fair market value that is determined by local assessors to be the total taxable value of land and additions on the property. | Land | Improvement |
|---|---|---|---|---|
| 2025 | $2,131 | $246,990 | $22,000 | $224,990 |
| 2024 | $2,131 | $246,990 | $22,000 | $224,990 |
| 2023 | $2,131 | $246,990 | $22,000 | $224,990 |
| 2022 | $2,091 | $246,990 | $22,000 | $224,990 |
| 2021 | $2,096 | $241,670 | $22,000 | $219,670 |
| 2020 | $2,134 | $241,670 | $22,000 | $219,670 |
| 2019 | $2,134 | $241,670 | $22,000 | $219,670 |
| 2018 | $2,134 | $241,670 | $22,000 | $219,670 |
| 2017 | $2,134 | $241,670 | $22,000 | $219,670 |
| 2016 | $2,094 | $241,670 | $22,000 | $219,670 |
| 2015 | $2,094 | $241,670 | $22,000 | $219,670 |
| 2014 | $2,068 | $241,670 | $22,000 | $219,670 |
| 2013 | -- | $216,890 | $33,000 | $183,890 |
Source: Public Records
Map
Nearby Homes
- 573 Thorncliff Dr
- 258 Lennox Loop
- 180 Barkley Ct
- 225 Hogart St
- 667 Saint Johns Loop
- 220 Ladden Ln
- 168 Bennington Dr
- 265 Huntington Dr
- 202 Ivy Stone Dr
- 865 Fairfield Cir
- 207 Boswell St
- 386 Forrest Woods Dr
- 260 Stockbridge Dr
- 161 Bayleaf Dr
- 273 Saint George Dr
- 131 Emerywood Ct
- 626 Fairfield Cir
- 1093 Saint Johns Loop
- 202 Crestwood Ln
- 0 Fayettevill Raod and Paraclete Dr
- 404 Windover Dr
- 418 Windover (L509) Dr
- 390 Windover Dr
- 418 Windover Dr
- 378 Windover Dr
- 397 Windover Dr
- 378 Windover (L512) Dr
- 434 Windover (L508) Dr
- 425 Windover Dr
- 434 Windover Dr
- 363 Windover Dr
- 364 Windover Dr
- 450 Windover Dr
- 453 Windover Dr
- 348 Windover Dr
- 333 Windover Dr
- 472 Windover Dr
- 473 Windover Dr
- 537 Thorncliff Dr
- 307 Windover Dr