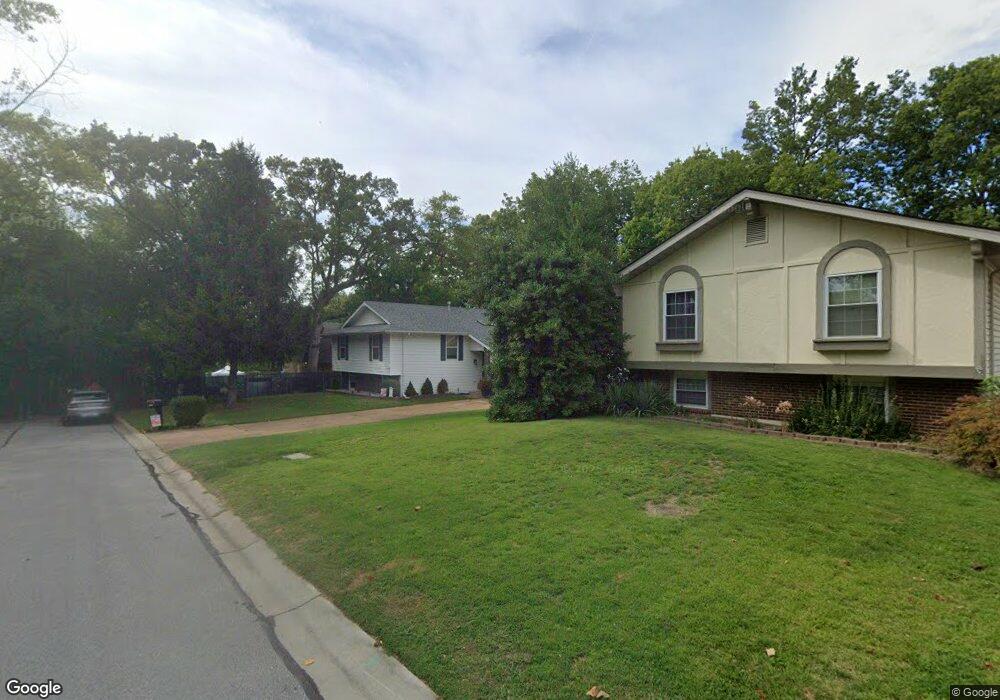
4040 Bellvue Dr Saint Peters, MO 63376
Estimated Value: $273,000 - $315,000
3
Beds
2
Baths
1,232
Sq Ft
$242/Sq Ft
Est. Value
About This Home
This home is located at 4040 Bellvue Dr, Saint Peters, MO 63376 and is currently estimated at $297,652, approximately $241 per square foot. 4040 Bellvue Dr is a home located in St. Charles County with nearby schools including Harris Elementary School, Jefferson Intermediate School, and Hardin Middle School.
Ownership History
Date
Name
Owned For
Owner Type
Purchase Details
Closed on
Dec 10, 2020
Sold by
Alexander Carol and Plenge Robert
Bought by
Redmond Donald
Current Estimated Value
Home Financials for this Owner
Home Financials are based on the most recent Mortgage that was taken out on this home.
Original Mortgage
$203,152
Outstanding Balance
$181,188
Interest Rate
2.8%
Mortgage Type
FHA
Estimated Equity
$116,464
Purchase Details
Closed on
Jan 31, 2005
Sold by
Alexander Carol and Plenge Robert
Bought by
Alexander Carol and Plenge Robert
Purchase Details
Closed on
Apr 23, 2004
Sold by
Cochrum Randy A and Cochrum Stasia L
Bought by
Plenge Robert and Alexander Carol
Purchase Details
Closed on
Jul 25, 1997
Sold by
Bowling Family Revocable Living Trust and Joe Billy
Bought by
Cochrum Randy A and Cochrum Stasia L
Home Financials for this Owner
Home Financials are based on the most recent Mortgage that was taken out on this home.
Original Mortgage
$81,200
Interest Rate
11.65%
Create a Home Valuation Report for This Property
The Home Valuation Report is an in-depth analysis detailing your home's value as well as a comparison with similar homes in the area
Home Values in the Area
Average Home Value in this Area
Purchase History
| Date | Buyer | Sale Price | Title Company |
|---|---|---|---|
| Redmond Donald | -- | Select Title Group | |
| Alexander Carol | -- | -- | |
| Plenge Robert | $124,000 | -- | |
| Cochrum Randy A | -- | -- |
Source: Public Records
Mortgage History
| Date | Status | Borrower | Loan Amount |
|---|---|---|---|
| Open | Redmond Donald | $203,152 | |
| Previous Owner | Cochrum Randy A | $81,200 | |
| Closed | Cochrum Randy A | $15,150 |
Source: Public Records
Tax History Compared to Growth
Tax History
| Year | Tax Paid | Tax Assessment Tax Assessment Total Assessment is a certain percentage of the fair market value that is determined by local assessors to be the total taxable value of land and additions on the property. | Land | Improvement |
|---|---|---|---|---|
| 2025 | $3,277 | $46,366 | -- | -- |
| 2023 | $3,270 | $43,806 | $0 | $0 |
| 2022 | $3,031 | $37,960 | $0 | $0 |
| 2021 | $3,026 | $37,960 | $0 | $0 |
| 2020 | $2,609 | $31,872 | $0 | $0 |
| 2019 | $2,590 | $31,872 | $0 | $0 |
| 2018 | $2,446 | $28,901 | $0 | $0 |
| 2017 | $2,435 | $28,901 | $0 | $0 |
| 2016 | $2,373 | $28,166 | $0 | $0 |
| 2015 | $2,369 | $28,166 | $0 | $0 |
| 2014 | $2,075 | $24,298 | $0 | $0 |
Source: Public Records
Map
Nearby Homes
- 1344 Cave Springs Estate Dr
- 1410 Ticonderoga Dr
- 1309 Cave Springs Estate Dr
- 110 Phyllisaire Ct
- 303 Laurel Lea Dr
- 1705 Cap Au Gris Dr
- 43 Plum Tree Dr
- 415 Lantana Ln
- 6 Avocado Tree Cir
- 102 Fountainview Dr
- 17 Avocado Tree Cir
- 132 Plum Tree Dr
- 3830 Jackson Trail
- 824 Highland Hill Ct Unit H
- 2223 Highland Hill Dr Unit E
- 46 River Boat Dr
- 2001 Maple Tree St
- 897 Delray Dr Unit B
- 2107 Golden Hills
- 1008 Autumn Leaf Dr
- 4036 Bellvue Dr
- 113 Gailwood Dr
- 111 Gailwood Dr
- 357 Jungermann Rd
- 115 Gailwood Dr
- 30 Craig Martin Ct
- 4032 Bellvue Dr
- 109 Gailwood Dr
- 117 Gailwood Dr
- 31 Craig Martin Ct
- 4028 Bellvue Dr
- 107 Gailwood Dr
- 4029 Bellvue Dr
- 119 Gailwood Dr
- 2 Gailwood Ct
- 32 Craig Martin Ct
- 4025 Bellvue Dr
- 4024 Bellvue Dr
- 120 Gailwood Dr
- 44 Craig Martin Ct