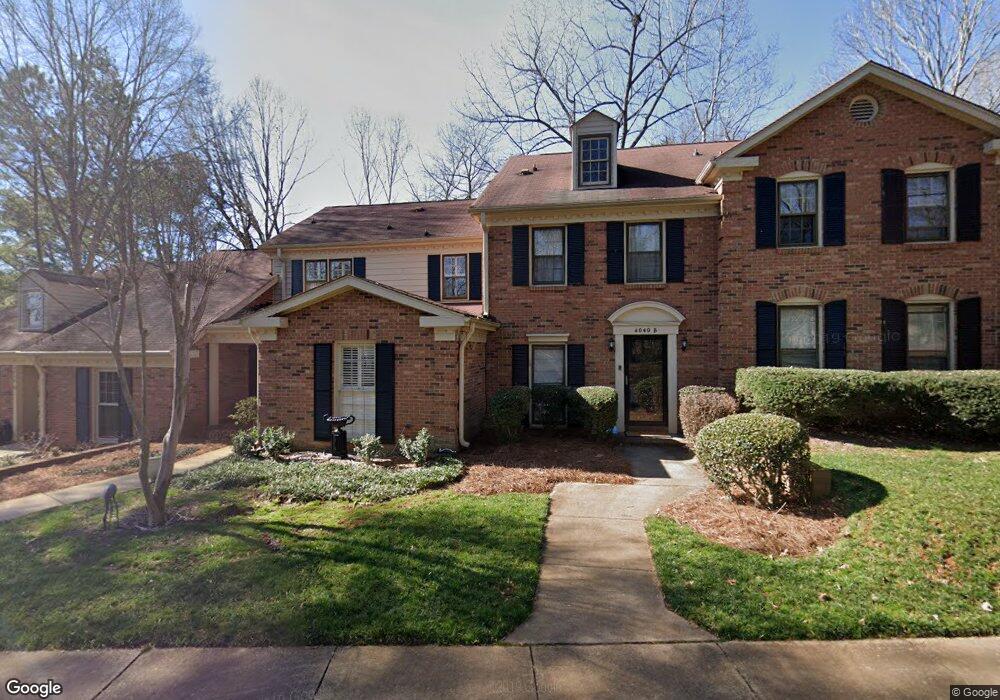
4040 Ivystone Ct Unit D Charlotte, NC 28277
Raintree NeighborhoodEstimated Value: $305,000 - $332,000
2
Beds
2
Baths
1,191
Sq Ft
$266/Sq Ft
Est. Value
About This Home
This home is located at 4040 Ivystone Ct Unit D, Charlotte, NC 28277 and is currently estimated at $317,388, approximately $266 per square foot. 4040 Ivystone Ct Unit D is a home located in Mecklenburg County with nearby schools including Olde Providence Elementary, South Charlotte Middle, and Providence High.
Ownership History
Date
Name
Owned For
Owner Type
Purchase Details
Closed on
Apr 3, 2017
Sold by
Gargano Vicki C and Gargano Arthur J
Bought by
Boczko Katalin and Boczko Katalin E
Current Estimated Value
Home Financials for this Owner
Home Financials are based on the most recent Mortgage that was taken out on this home.
Original Mortgage
$50,000
Outstanding Balance
$41,539
Interest Rate
4.15%
Mortgage Type
New Conventional
Estimated Equity
$275,849
Purchase Details
Closed on
Nov 13, 2003
Sold by
Sandman Marc and Sandman Bobbie J
Bought by
Gargano Arthur J and Gargano Vicki C
Purchase Details
Closed on
Dec 8, 2000
Sold by
Fletcher Deborah E and Robert Fletcher J
Bought by
Sandman Marc
Home Financials for this Owner
Home Financials are based on the most recent Mortgage that was taken out on this home.
Original Mortgage
$63,900
Interest Rate
7.71%
Mortgage Type
Purchase Money Mortgage
Create a Home Valuation Report for This Property
The Home Valuation Report is an in-depth analysis detailing your home's value as well as a comparison with similar homes in the area
Home Values in the Area
Average Home Value in this Area
Purchase History
| Date | Buyer | Sale Price | Title Company |
|---|---|---|---|
| Boczko Katalin | $136,000 | None Available | |
| Gargano Arthur J | $103,000 | -- | |
| Sandman Marc | $114,000 | -- |
Source: Public Records
Mortgage History
| Date | Status | Borrower | Loan Amount |
|---|---|---|---|
| Open | Boczko Katalin | $50,000 | |
| Previous Owner | Sandman Marc | $63,900 |
Source: Public Records
Tax History Compared to Growth
Tax History
| Year | Tax Paid | Tax Assessment Tax Assessment Total Assessment is a certain percentage of the fair market value that is determined by local assessors to be the total taxable value of land and additions on the property. | Land | Improvement |
|---|---|---|---|---|
| 2025 | $1,222 | $282,300 | $60,000 | $222,300 |
| 2024 | $1,222 | $282,300 | $60,000 | $222,300 |
| 2023 | $2,210 | $282,300 | $60,000 | $222,300 |
| 2022 | $912 | $176,000 | $55,000 | $121,000 |
| 2021 | $1,813 | $176,000 | $55,000 | $121,000 |
| 2020 | $1,806 | $176,000 | $55,000 | $121,000 |
| 2019 | $1,790 | $176,000 | $55,000 | $121,000 |
| 2018 | $1,770 | $129,300 | $34,500 | $94,800 |
| 2017 | $1,737 | $129,300 | $34,500 | $94,800 |
| 2016 | $1,727 | $129,300 | $34,500 | $94,800 |
| 2015 | $1,716 | $129,300 | $34,500 | $94,800 |
| 2014 | $1,700 | $129,300 | $34,500 | $94,800 |
Source: Public Records
Map
Nearby Homes
- 4301 Rosecliff Dr
- 5808 Copperleaf Commons Ct
- 8928 Saint Croix Ln
- 8600 Brownes Pond Ln
- 10208 Thomas Payne Cir
- 10400 Nine Iron Ct
- 4005 Woodfox Dr
- 9104 Four Mile Creek Rd
- 10016 Whitethorn Dr
- 9514 Fairway Ridge Rd
- 9305 Four Mile Creek Rd
- 8159 Circle Tree Ln
- 9116 Arbourgate Meadows Ln
- 9114 Arbourgate Meadows Ln
- 8500 Peyton Randolph Dr
- 9218 Arbourgate Meadows Ln
- 8131 Raintree Ln
- 3717 Smokerise Hill Dr
- 5912 Alexa Rd
- 3310 Windbluff Dr
- 4040 Ivystone Ct
- 4040 Ivystone Ct Unit A
- 4040 Ivystone Ct Unit B
- 4040 Ivystone Ct Unit C
- 4040 Ivystone Ct Unit 9
- 4020 Ivystone Ct
- 4020 Ivystone Ct Unit D
- 4020 Ivystone Ct Unit C
- 4020 Ivystone Ct Unit A
- 4200 Ivystone Ct
- 4838 Truesdale Place
- 4830 Truesdale Place
- 4844 Truesdale Place
- 4161 Ivystone Ct Unit C
- 4161 Ivystone Ct Unit D
- 4161 Ivystone Ct Unit C
- 4161 Ivystone Ct Unit B
- 4161 Ivystone Ct Unit A
- 4161 Ivystone Ct
- 4852 Truesdale Place