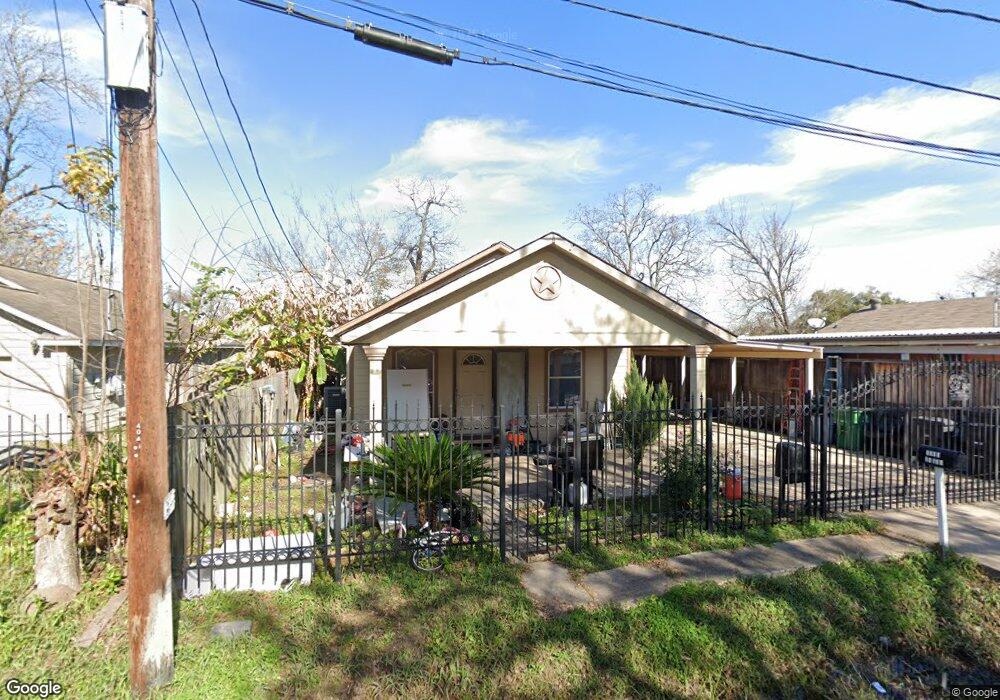
4041 Lelia St Houston, TX 77026
Fifth Ward NeighborhoodEstimated Value: $198,685 - $283,000
2
Beds
3
Baths
2,270
Sq Ft
$108/Sq Ft
Est. Value
About This Home
This home is located at 4041 Lelia St, Houston, TX 77026 and is currently estimated at $245,421, approximately $108 per square foot. 4041 Lelia St is a home located in Harris County with nearby schools including Dogan Elementary School, Fleming Middle School, and Wheatley High School.
Ownership History
Date
Name
Owned For
Owner Type
Purchase Details
Closed on
Nov 30, 2018
Sold by
Rehab Hoses Of Houston Llc
Bought by
Garcia Tlaloc
Current Estimated Value
Purchase Details
Closed on
Nov 18, 2005
Sold by
Salas Luis and Salas Louis
Bought by
Hernandez Remigio
Home Financials for this Owner
Home Financials are based on the most recent Mortgage that was taken out on this home.
Original Mortgage
$8,000
Interest Rate
6.04%
Mortgage Type
Seller Take Back
Create a Home Valuation Report for This Property
The Home Valuation Report is an in-depth analysis detailing your home's value as well as a comparison with similar homes in the area
Home Values in the Area
Average Home Value in this Area
Purchase History
| Date | Buyer | Sale Price | Title Company |
|---|---|---|---|
| Garcia Tlaloc | -- | Texas American Title Company | |
| Hernandez Remigio | -- | American Title Co |
Source: Public Records
Mortgage History
| Date | Status | Borrower | Loan Amount |
|---|---|---|---|
| Previous Owner | Hernandez Remigio | $8,000 |
Source: Public Records
Tax History Compared to Growth
Tax History
| Year | Tax Paid | Tax Assessment Tax Assessment Total Assessment is a certain percentage of the fair market value that is determined by local assessors to be the total taxable value of land and additions on the property. | Land | Improvement |
|---|---|---|---|---|
| 2025 | $1,073 | $255,840 | $60,000 | $195,840 |
| 2024 | $1,073 | $238,167 | $60,000 | $178,167 |
| 2023 | $1,073 | $233,702 | $51,250 | $182,452 |
| 2022 | $1,989 | $206,059 | $33,750 | $172,309 |
| 2021 | $1,914 | $179,284 | $22,500 | $156,784 |
| 2020 | $1,808 | $168,709 | $22,500 | $146,209 |
| 2019 | $1,717 | $141,208 | $22,500 | $118,708 |
| 2018 | $953 | $92,656 | $16,250 | $76,406 |
| 2017 | $1,418 | $92,656 | $16,250 | $76,406 |
| 2016 | $1,289 | $87,286 | $13,750 | $73,536 |
| 2015 | $691 | $94,086 | $12,500 | $81,586 |
| 2014 | $691 | $94,086 | $12,500 | $81,586 |
Source: Public Records
Map
Nearby Homes