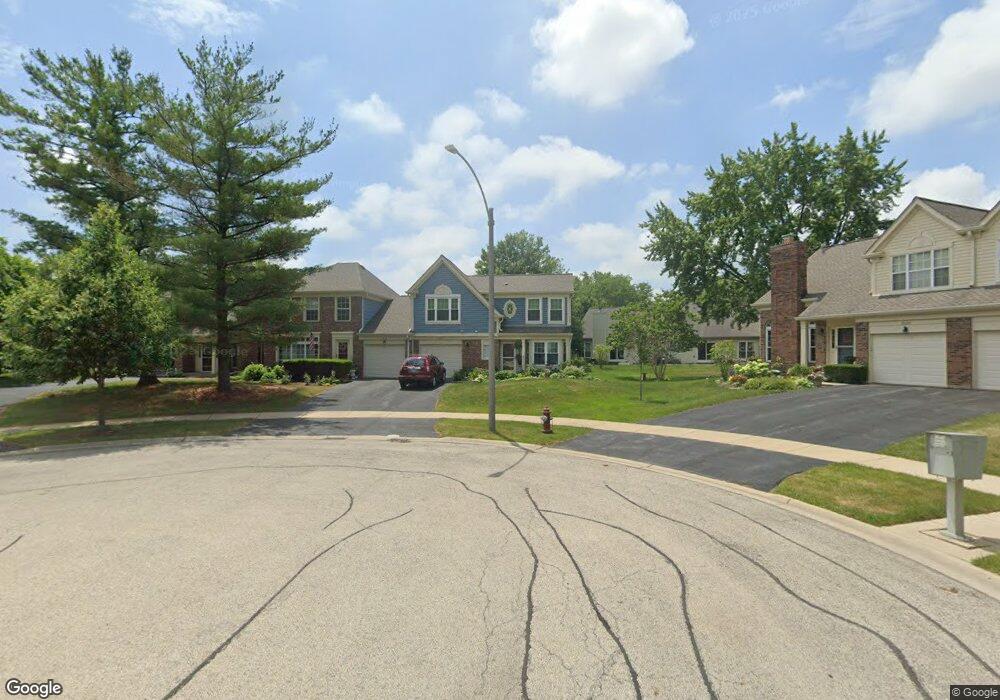
4042 N Newport Ln Unit 19-1 Arlington Heights, IL 60004
Estimated Value: $295,683 - $327,000
2
Beds
2
Baths
1,400
Sq Ft
$227/Sq Ft
Est. Value
About This Home
This home is located at 4042 N Newport Ln Unit 19-1, Arlington Heights, IL 60004 and is currently estimated at $317,671, approximately $226 per square foot. 4042 N Newport Ln Unit 19-1 is a home located in Cook County with nearby schools including Edgar A. Poe Elementary School, Cooper Middle School, and Buffalo Grove High School.
Ownership History
Date
Name
Owned For
Owner Type
Purchase Details
Closed on
Jul 25, 2003
Sold by
Campo Vincent G and Royales Campo M Robinette
Bought by
Tsiampas George and Tsiampas Anthoula
Current Estimated Value
Home Financials for this Owner
Home Financials are based on the most recent Mortgage that was taken out on this home.
Original Mortgage
$160,000
Outstanding Balance
$71,652
Interest Rate
5.97%
Mortgage Type
Purchase Money Mortgage
Estimated Equity
$246,019
Purchase Details
Closed on
Sep 26, 1997
Sold by
Shoback Thomas R and Shoback Martha A
Bought by
Campo Vincent G and Robinette Royales M
Home Financials for this Owner
Home Financials are based on the most recent Mortgage that was taken out on this home.
Original Mortgage
$141,075
Interest Rate
7.54%
Create a Home Valuation Report for This Property
The Home Valuation Report is an in-depth analysis detailing your home's value as well as a comparison with similar homes in the area
Home Values in the Area
Average Home Value in this Area
Purchase History
| Date | Buyer | Sale Price | Title Company |
|---|---|---|---|
| Tsiampas George | $230,000 | Heritage Title Company | |
| Campo Vincent G | $99,000 | Chicago Title Insurance Co |
Source: Public Records
Mortgage History
| Date | Status | Borrower | Loan Amount |
|---|---|---|---|
| Open | Tsiampas George | $160,000 | |
| Previous Owner | Campo Vincent G | $141,075 |
Source: Public Records
Tax History Compared to Growth
Tax History
| Year | Tax Paid | Tax Assessment Tax Assessment Total Assessment is a certain percentage of the fair market value that is determined by local assessors to be the total taxable value of land and additions on the property. | Land | Improvement |
|---|---|---|---|---|
| 2024 | $7,096 | $22,644 | $3,673 | $18,971 |
| 2023 | $6,763 | $22,644 | $3,673 | $18,971 |
| 2022 | $6,763 | $22,644 | $3,673 | $18,971 |
| 2021 | $6,882 | $19,893 | $510 | $19,383 |
| 2020 | $6,698 | $19,893 | $510 | $19,383 |
| 2019 | $6,728 | $22,081 | $510 | $21,571 |
| 2018 | $6,610 | $19,436 | $408 | $19,028 |
| 2017 | $6,488 | $19,436 | $408 | $19,028 |
| 2016 | $5,288 | $19,436 | $408 | $19,028 |
| 2015 | $4,889 | $17,030 | $1,734 | $15,296 |
| 2014 | $4,836 | $17,030 | $1,734 | $15,296 |
| 2013 | $4,477 | $17,030 | $1,734 | $15,296 |
Source: Public Records
Map
Nearby Homes
- 1611 W Partridge Ct Unit 8
- 1631 W Partridge Ct Unit 8
- 3851 N Galena Ct
- 4242 N Pheasant Trail Ct Unit 1
- 4210 N Mallard Dr Unit 4
- 1415 W Partridge Ln Unit 5
- 1942 Trail Ridge St
- 1727 W Hawkes St Unit 8
- 3926 Newport Way Unit 51C1
- 2245 Nichols Rd Unit C
- 2134 N Ginger Creek Dr Unit 19D
- 2044 N Ginger Creek Dr Unit 30C
- 812 W Whiting Ln
- 4116 N Terramere Ave
- 715 W Whiting Ln
- 1255 E Canterbury Trail Unit 4
- 4220 Bonhill Dr Unit 3E
- 1168 Foxglove Ln Unit 6C
- 715 W Happfield Dr
- 1991 N Williamsburg Dr Unit 203
- 4038 N Newport Ln Unit 144
- 4036 N Newport Ln Unit 143
- 4034 N Newport Ln Unit 142
- 4048 N Newport Ln Unit 19-4
- 4032 N Newport Ln Unit 141
- 4050 N Newport Ln Unit 19-5
- 4053 N Newport Ln Unit 41
- 4057 N Newport Ln Unit 56
- 4051 N Newport Ln Unit 42
- 4045 N Newport Ln Unit 31
- 4043 N Newport Ln Unit 32
- 4059 N Newport Ln Unit 55
- 4041 N Newport Ln Unit 33
- 4049 N Newport Ln Unit 43
- 4044 N Newport Ln Unit 19-2
- 4061 N Newport Ln Unit 54
- 4047 N Newport Ln Unit 44
- 4020 N Newport Ln Unit 136
- 4046 N Newport Ct Unit 193
- 4046 N Newport Ct Unit 3