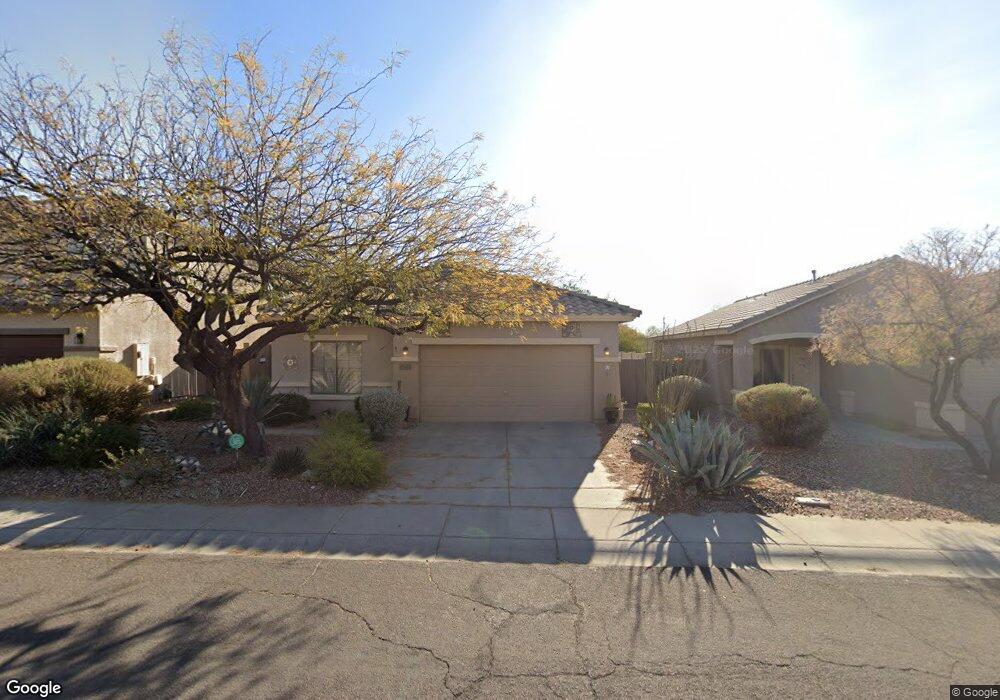
40429 N Acadia Ct Unit 19 Anthem, AZ 85086
Estimated Value: $398,440 - $457,000
3
Beds
2
Baths
1,672
Sq Ft
$261/Sq Ft
Est. Value
About This Home
This home is located at 40429 N Acadia Ct Unit 19, Anthem, AZ 85086 and is currently estimated at $436,860, approximately $261 per square foot. 40429 N Acadia Ct Unit 19 is a home located in Maricopa County with nearby schools including Anthem School, Boulder Creek High School, and BASIS Phoenix North.
Ownership History
Date
Name
Owned For
Owner Type
Purchase Details
Closed on
Nov 12, 2007
Sold by
Pactwa Mary Elizabeth
Bought by
Pactwa Mary Elizabeth and Mary Elizabeth Pactwa Revocable Trust
Current Estimated Value
Purchase Details
Closed on
Aug 26, 2003
Sold by
Feyereisen Mark A
Bought by
Pactwa Mary Elizabeth
Home Financials for this Owner
Home Financials are based on the most recent Mortgage that was taken out on this home.
Original Mortgage
$157,950
Outstanding Balance
$73,575
Interest Rate
6.3%
Mortgage Type
New Conventional
Estimated Equity
$363,285
Purchase Details
Closed on
Oct 24, 2000
Sold by
Del Webbs Coventry Homes Inc
Bought by
Feyereisen Mark A
Home Financials for this Owner
Home Financials are based on the most recent Mortgage that was taken out on this home.
Original Mortgage
$144,637
Interest Rate
6.98%
Mortgage Type
New Conventional
Create a Home Valuation Report for This Property
The Home Valuation Report is an in-depth analysis detailing your home's value as well as a comparison with similar homes in the area
Home Values in the Area
Average Home Value in this Area
Purchase History
| Date | Buyer | Sale Price | Title Company |
|---|---|---|---|
| Pactwa Mary Elizabeth | -- | None Available | |
| Pactwa Mary Elizabeth | $175,500 | Security Title Agency | |
| Feyereisen Mark A | $148,539 | First American Title | |
| Del Webbs Coventry Homes Inc | -- | First American Title |
Source: Public Records
Mortgage History
| Date | Status | Borrower | Loan Amount |
|---|---|---|---|
| Open | Pactwa Mary Elizabeth | $157,950 | |
| Previous Owner | Feyereisen Mark A | $144,637 |
Source: Public Records
Tax History Compared to Growth
Tax History
| Year | Tax Paid | Tax Assessment Tax Assessment Total Assessment is a certain percentage of the fair market value that is determined by local assessors to be the total taxable value of land and additions on the property. | Land | Improvement |
|---|---|---|---|---|
| 2025 | $2,376 | $22,125 | -- | -- |
| 2024 | $2,234 | $21,071 | -- | -- |
| 2023 | $2,234 | $33,130 | $6,620 | $26,510 |
| 2022 | $2,135 | $24,320 | $4,860 | $19,460 |
| 2021 | $2,199 | $22,480 | $4,490 | $17,990 |
| 2020 | $2,151 | $20,960 | $4,190 | $16,770 |
| 2019 | $2,110 | $20,100 | $4,020 | $16,080 |
| 2018 | $2,043 | $18,600 | $3,720 | $14,880 |
| 2017 | $2,003 | $17,510 | $3,500 | $14,010 |
| 2016 | $1,718 | $16,620 | $3,320 | $13,300 |
| 2015 | $1,667 | $16,000 | $3,200 | $12,800 |
Source: Public Records
Map
Nearby Homes
- 3546 W Webster Ct Unit 6
- 40711 N Ericson Ln
- 3437 W Walden Way
- 3723 W Memorial Dr
- 3544 W Twain Dr
- 40128 N Integrity Trail
- 3747 W Memorial Dr Unit 67
- 40915 N Columbia Trail
- 40015 N Pride Dr
- 3629 W Amerigo Ct Unit 41B
- 3422 W King Dr
- 3336 W King Dr Unit 9
- 3737 W Medinah Way
- 40924 N Crockett Trail
- 3716 W Medinah Way
- 39733 N Wisdom Way
- 3051 W Sousa Ct
- 40701 N Union Trail
- 3135 W Kuralt Ct
- 3033 W Keller Dr
- 40435 N Acadia Ct
- 40423 N Acadia Ct
- 40421 N Acadia Ct
- 40503 N Acadia Ct
- 40417 N Acadia Ct
- 40509 N Acadia Ct
- 40411 N Acadia Ct
- 3609 W Webster Ct
- 40405 N Acadia Ct
- 3615 W Webster Ct
- 3608 W Webster Ct
- 3612 W Sousa Ct
- 40521 N Acadia Ct
- 3614 W Webster Ct
- 3545 W Sousa Ct
- 3621 W Webster Ct
- 3618 W Sousa Ct
- 3554 W Morse Ct
- 3620 W Webster Ct
- 40527 N Acadia Ct