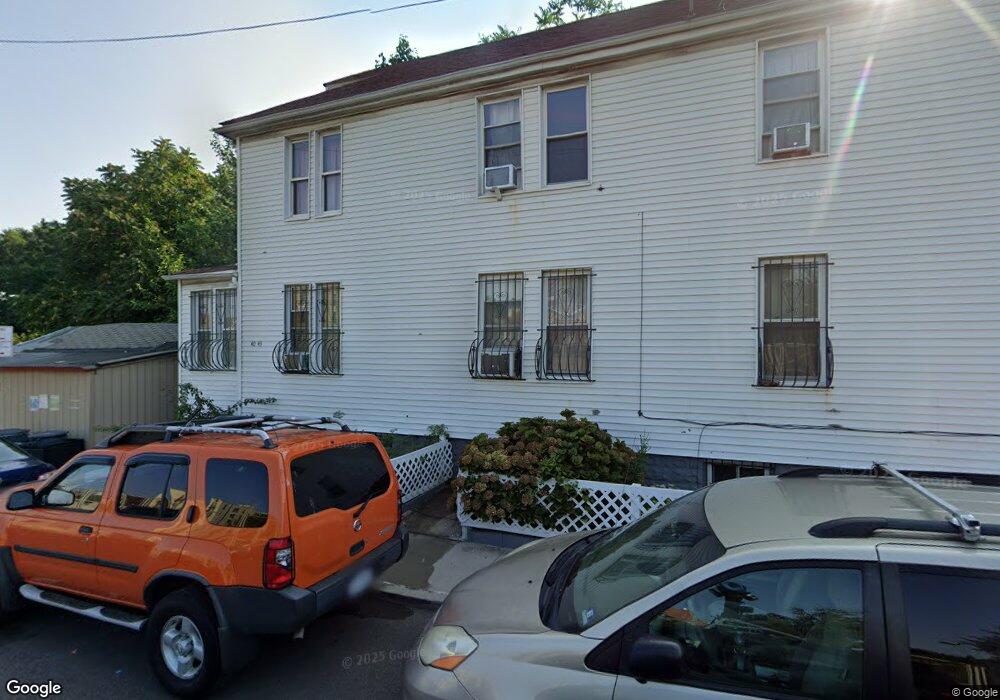
4043 71st St Woodside, NY 11377
Elmhurst NeighborhoodEstimated Value: $1,026,344 - $1,321,000
--
Bed
--
Bath
1,488
Sq Ft
$806/Sq Ft
Est. Value
About This Home
This home is located at 4043 71st St, Woodside, NY 11377 and is currently estimated at $1,199,336, approximately $806 per square foot. 4043 71st St is a home located in Queens County with nearby schools including P.S. 12 James B Colgate, William Cullen Bryant High School, and St. Joan of Arc Elementary School.
Ownership History
Date
Name
Owned For
Owner Type
Purchase Details
Closed on
Jan 20, 2005
Sold by
Akther Tahmina
Bought by
Ngawang Tsering and Tsomo Dekyi
Current Estimated Value
Home Financials for this Owner
Home Financials are based on the most recent Mortgage that was taken out on this home.
Original Mortgage
$566,400
Outstanding Balance
$284,409
Interest Rate
5.77%
Mortgage Type
Purchase Money Mortgage
Estimated Equity
$914,927
Purchase Details
Closed on
Jul 1, 2004
Sold by
Islam Mohammad
Bought by
Akther Tahmina
Purchase Details
Closed on
Jul 3, 2002
Sold by
Khan Mohammad A and Khanam Bilkis A
Bought by
Islam Mohammad
Purchase Details
Closed on
May 26, 2000
Sold by
Kamal Helena
Bought by
Khan Mohammad A and Khanam Bilkis A
Home Financials for this Owner
Home Financials are based on the most recent Mortgage that was taken out on this home.
Original Mortgage
$323,000
Interest Rate
8.12%
Purchase Details
Closed on
Dec 17, 1999
Sold by
Vella Nazareno
Bought by
Kamal Helena
Home Financials for this Owner
Home Financials are based on the most recent Mortgage that was taken out on this home.
Original Mortgage
$250,400
Interest Rate
7.79%
Mortgage Type
FHA
Purchase Details
Closed on
Feb 28, 1997
Sold by
Silvaside Construction Co Inc
Bought by
Vella Nazareno
Home Financials for this Owner
Home Financials are based on the most recent Mortgage that was taken out on this home.
Original Mortgage
$148,000
Interest Rate
7.55%
Purchase Details
Closed on
Aug 26, 1996
Sold by
Hafner Zdenka and Brock Joanne
Bought by
Silverside Construction Company Inc
Create a Home Valuation Report for This Property
The Home Valuation Report is an in-depth analysis detailing your home's value as well as a comparison with similar homes in the area
Home Values in the Area
Average Home Value in this Area
Purchase History
| Date | Buyer | Sale Price | Title Company |
|---|---|---|---|
| Ngawang Tsering | $708,000 | -- | |
| Ngawang Tsering | $708,000 | -- | |
| Akther Tahmina | -- | -- | |
| Akther Tahmina | -- | -- | |
| Islam Mohammad | -- | -- | |
| Islam Mohammad | -- | -- | |
| Khan Mohammad A | $360,000 | -- | |
| Khan Mohammad A | $360,000 | -- | |
| Kamal Helena | $262,500 | First American Title Ins Co | |
| Kamal Helena | $262,500 | First American Title Ins Co | |
| Vella Nazareno | $185,000 | Lawyers Title Insurance Corp | |
| Vella Nazareno | $185,000 | Lawyers Title Insurance Corp | |
| Silverside Construction Company Inc | -- | -- | |
| Silverside Construction Company Inc | -- | -- | |
| Silverside Construction Company Inc | $135,000 | Chicago Title Insurance Co | |
| Silverside Construction Company Inc | $135,000 | Chicago Title Insurance Co |
Source: Public Records
Mortgage History
| Date | Status | Borrower | Loan Amount |
|---|---|---|---|
| Open | Ngawang Tsering | $566,400 | |
| Closed | Ngawang Tsering | $566,400 | |
| Previous Owner | Khan Mohammad A | $323,000 | |
| Previous Owner | Kamal Helena | $250,400 | |
| Previous Owner | Vella Nazareno | $148,000 |
Source: Public Records
Tax History Compared to Growth
Tax History
| Year | Tax Paid | Tax Assessment Tax Assessment Total Assessment is a certain percentage of the fair market value that is determined by local assessors to be the total taxable value of land and additions on the property. | Land | Improvement |
|---|---|---|---|---|
| 2025 | $5,997 | $31,650 | $7,016 | $24,634 |
| 2024 | $5,997 | $29,860 | $7,555 | $22,305 |
| 2023 | $5,997 | $29,860 | $6,407 | $23,453 |
| 2022 | $5,915 | $63,840 | $16,440 | $47,400 |
| 2021 | $5,883 | $63,660 | $16,440 | $47,220 |
| 2020 | $5,583 | $60,060 | $16,440 | $43,620 |
| 2019 | $5,205 | $53,040 | $16,440 | $36,600 |
| 2018 | $5,072 | $24,883 | $6,744 | $18,139 |
| 2017 | $5,034 | $24,693 | $8,985 | $15,708 |
| 2016 | $4,657 | $24,693 | $8,985 | $15,708 |
| 2015 | $2,810 | $21,979 | $10,032 | $11,947 |
| 2014 | $2,810 | $20,736 | $11,297 | $9,439 |
Source: Public Records
Map
Nearby Homes
- 4110 71st St
- 4139 70th St
- 41-49 71st St
- 41-39 70th St
- 40-43 73rd St
- 40 E 73rd St
- 40-26 69th St
- 41-42 73rd St Unit 7J
- 41-42 73rd St Unit 6J
- 40-08 69th St
- 69-22 38th Ave
- 41-59 70th St
- 41-70 71st St
- 40-33 74th St
- 40-40 68th St Unit 1A
- 4155 73rd St
- 4040 75th St Unit 5D
- 40-40 75th St Unit 7C
- 40-40 75th St Unit 3J
- 41-60 74th St